ternaryBin
Options
Option |
Description |
Argument |
|---|---|---|
--samples |
Sample names. It determines the plotting order [required] |
[char …] |
--gipOut |
GIP output directory [default gipOut] |
[char] |
--outName |
Output name [default gipOut/sampleComparison/ternaryBin] |
[char] |
--chrs |
Chromosomes to use. If “NA” it uses the same chromsomes as GIP [default NA] |
[char …] |
--minMAPQ |
Remove bins with MAPQ < –MAPQ [default 0] |
[int] |
--pseudocount |
Normalized mean coverage pseudocount value (for ternary plot only) [default 0.1] |
[double] |
--highLowDensityColor |
Colors for high and low density [default black deepskyblue] |
[char char] |
--densityN |
Number of grid points in each direction [default 200] |
[int] |
--densityBins |
Number bins over which to calculate intervals [default 8000] |
[int] |
--showSubset |
Show a random subset of genomic bins. Does not affect the density estimation [default 5000] |
[int] |
--debug |
Dump session and quit |
|
-h, --help |
Show help message |
Description
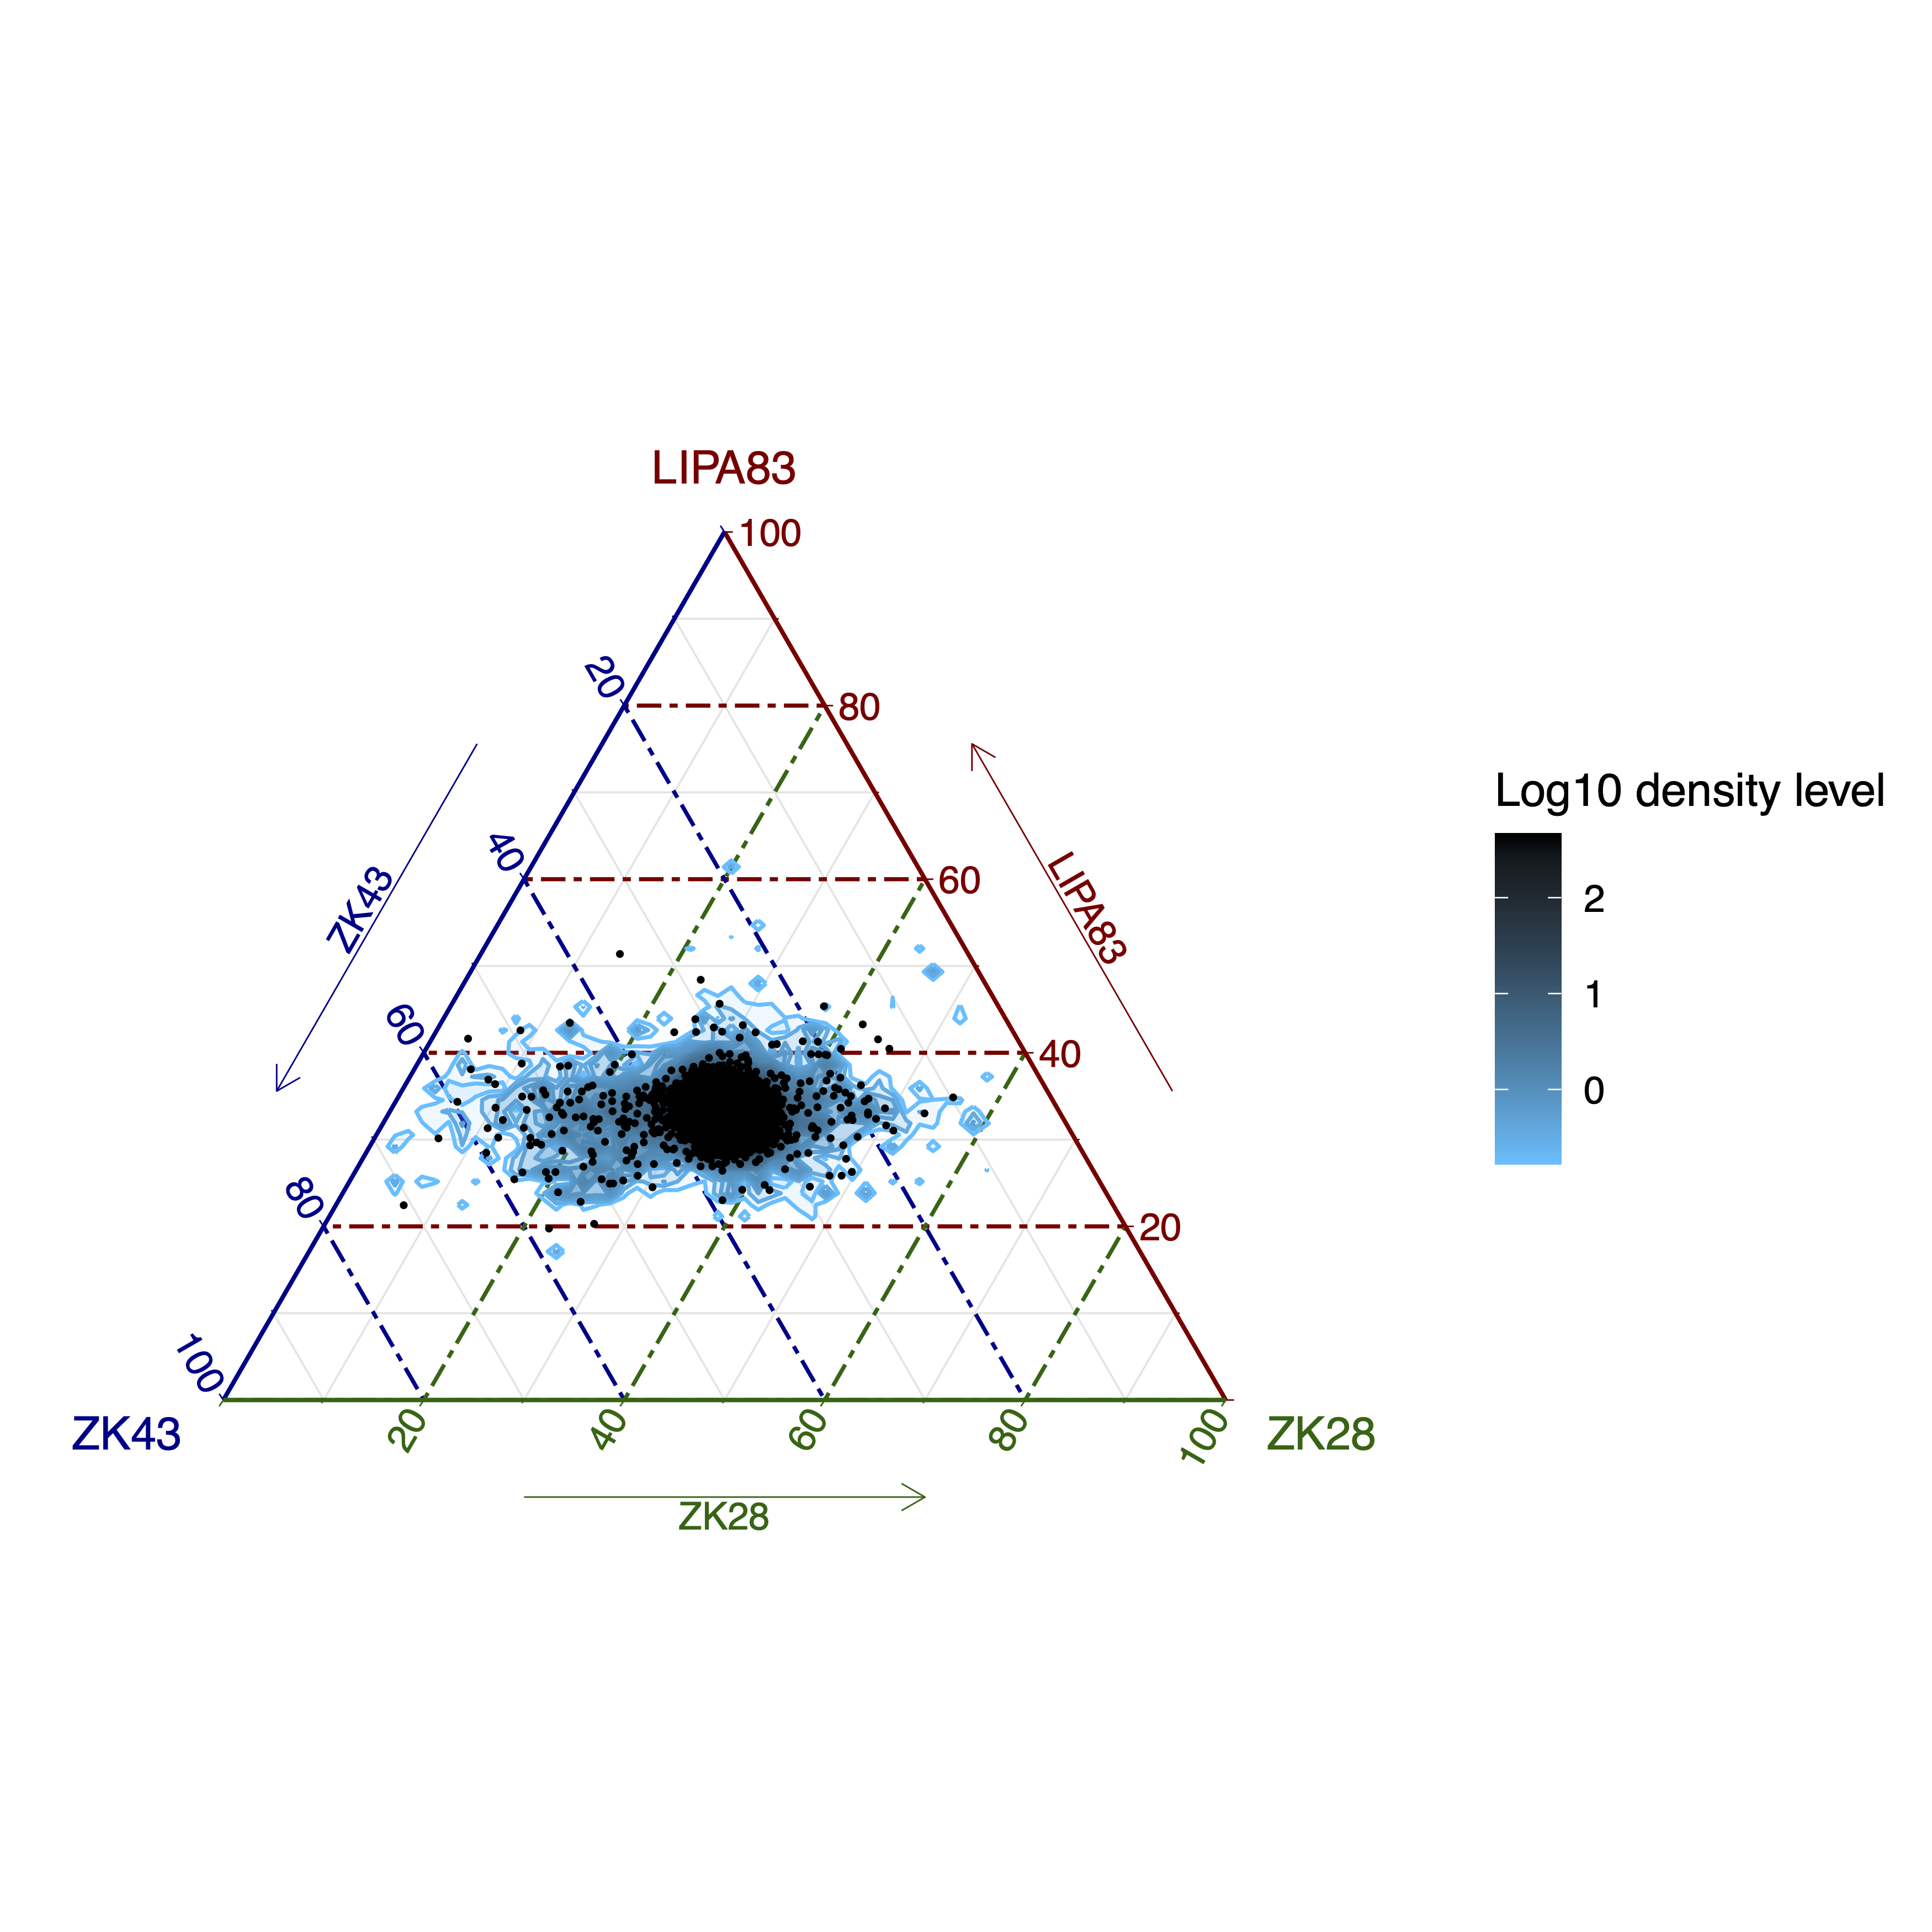
ternaryBin module aims at comparing the bin sequencing coverage of 3 samples to identify CNVs regions.Example
giptools ternaryBin --samples ZK43 LIPA83 ZK28--densityN and --densityBins to adjust the density area representation. For instance adding to the previous example the parameters --densityN 150 --densityBins 3000 results in the following plot: