genomeDistance
Options
Option |
Description |
Argument |
|---|---|---|
--samples |
Sample names. It determines the plotting order If “NA” all samples are used [default NA] |
[char …] |
--gipOut |
GIP output director [default gipOut] |
[char] |
--outName |
Output name [default gipOut/sampleComparison/genomeDistance] |
[char] |
--contextGenomes |
Two columns TSV file listing additional genomes. Syntax: name<Tab>filePath [default NA] |
[char] |
--customColors |
TSV file with 2 columns named “SAMPLE” and “COLOR” indicating the color to be used for each sample. If “NA” all samples are shown in black [default NA] |
[char] |
--phylogenyDistance |
Distance matrix e.g. the phylogeny.treefile.distMat.gz file produced with the phylogeny module. If “NA” the ANI distance is measured [dafault NA] |
[char] |
--PCAlabel |
Show PCA labels [default all] |
[all|none] |
--debug |
Dump session and quit |
|
-h, --help |
Show help message |
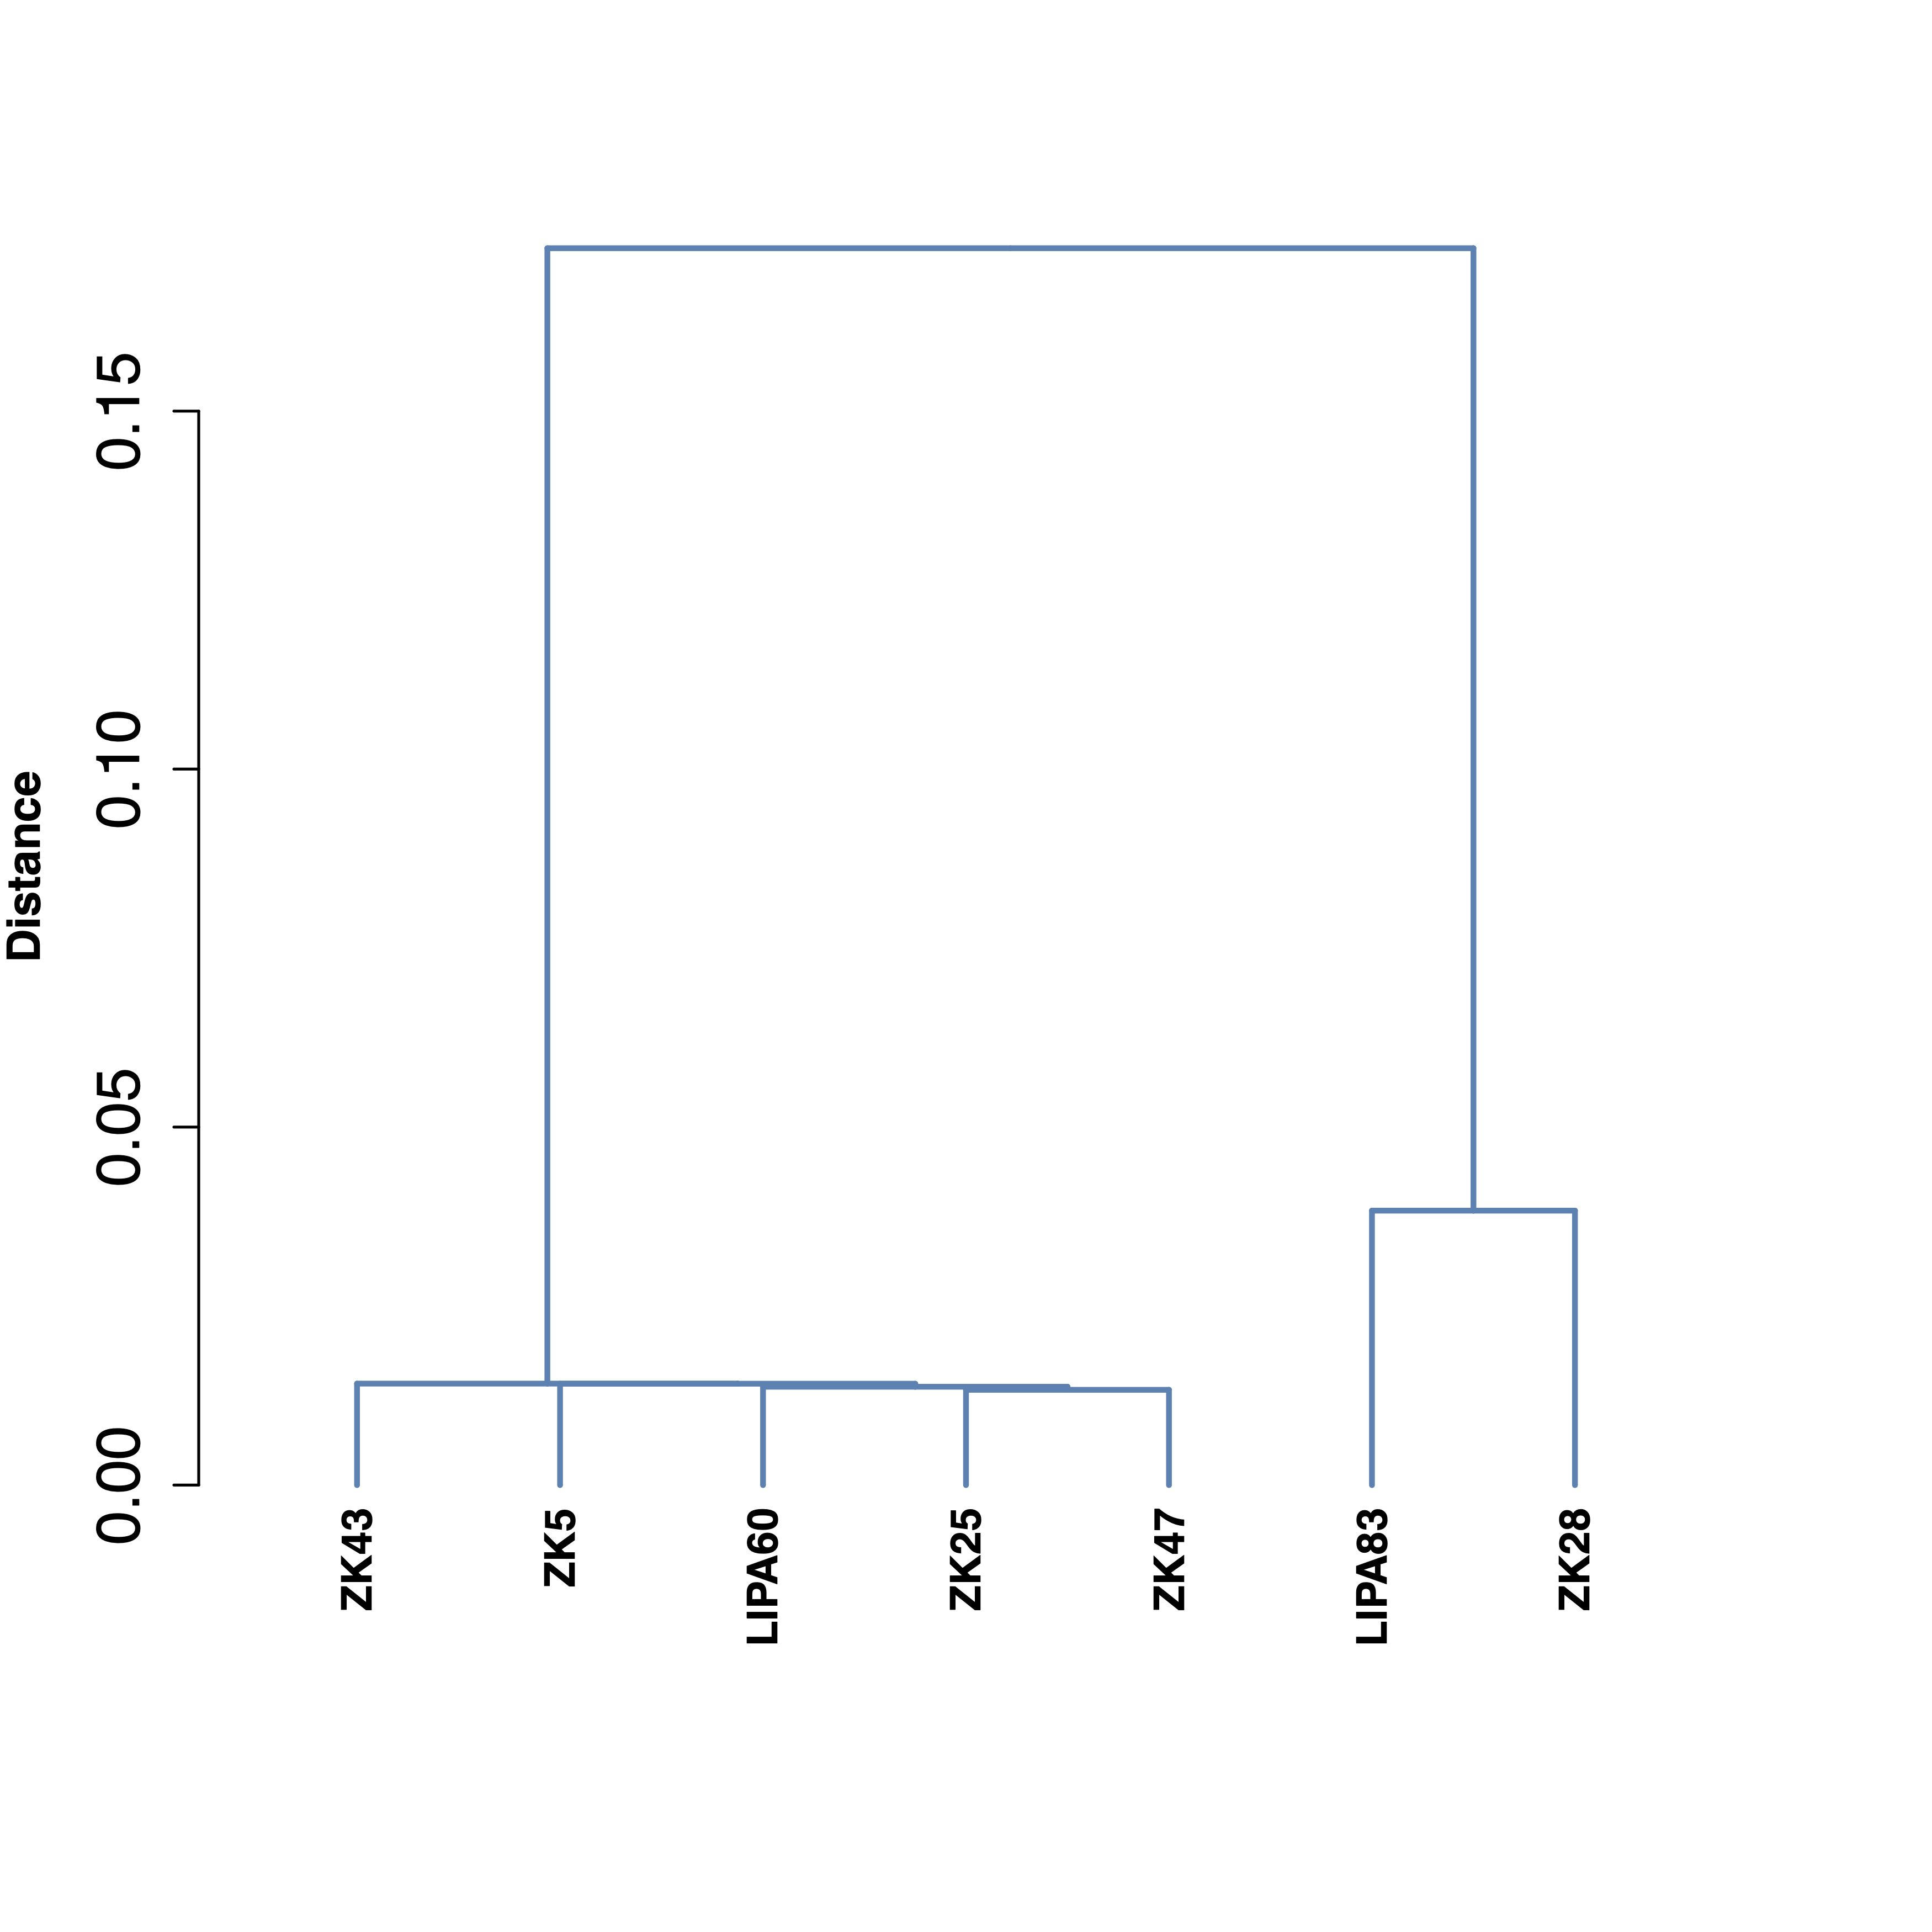
Description
genomeDistance module is meant to compare the genomic distance of the samples of interest.phylogeny module.Example
giptools genomeDistance