geInteraction
Options
Option |
Description |
Argument |
|---|---|---|
--samplesList |
File with a column named "sample" listing samples names. Additional TSV columns will be used to annotate the output figures. "field"_COLOR columns are used to map colors to the additional fields [required] |
[char] |
--gipOut |
GIP output directory [default gipOut] |
[char] |
--outName |
Output name [default gipOut/sampleComparison/geInteraction] |
[char] |
--chrs |
Chromosomes to use. If “NA” it uses the same chromsomes as GIP [default NA] |
[char …] |
--minMAPQ |
Remove genes with MAPQ < –MAPQ [default 0] |
[int] |
--minDelta |
Min normalized coverage delta between samples [default 1] |
[double] |
--minMaxCov |
Use only genes with normalized coverage >Value1 or <Value2 in at least one sample. If "NA" no filter is applied [default NA] |
[num num] |
--rmNotSigGenes |
Use only genes with significant coverage in at least one of the samples |
|
--heatmapType |
Gene normalized coverage value transformation used for the CNV vs samples heatmap. [default scaled] |
[scaled | log10 saturated | flatten] |
--covSaturation |
Gene normalized coverage saturation value. DEPENDENCY --heatmapType "saturated" or "flatten" [default 3] |
[int] |
--quantileSaturation |
Provide two numbers. Saturate the colors of the gene CNV vs samples heatmap for quantiles < num1 or > num2 DEPENDENCY --heatmapType "scaled" or "log10"” [default 0 1] |
[double double] |
--doNotClusterSamples |
Do not cluster heatmap columns. Show the samples in the same order as in --samplesList |
|
--clusteringMethod |
Heatmaps clustering method [default complete] |
[ward.D2|ward.D single|complete average|mcquitty median|centroid] |
-cutree_cnv |
Based on the hierarchical clustering, divide the genes in this number of clusters [default 1] |
[int] |
--cutree_samp |
Based on the hierarchical clustering, divide the samples in this number of clusters [default 1] |
[int] |
--show_geneNames |
Show gene names in the heatmaps |
|
--show_sampNames |
Show sample names in the heatmaps |
|
--cnvPlotDim |
CNVs vs samples heatmap file height and width values [default 11 6] |
[double double] |
--corPlotDim |
CNVs vs CNVs heatmap file height and width values [default 11 11] |
[double double] |
--lolPlotDim |
Lollipop plot file height and width values [default 7 4] |
[double double] |
--kmeansClusters |
Use this number of k-means clusters for clustering. If "NA" use mclust [default NA] |
[int] |
--MCLinflation |
Use this MCL inflation value for clustering. Higher inflation values result in increased cluster granularity. If "NA" use mclust [default NA] |
[int] |
--MCLexpansion |
MCL expansion value. DEPENDENCY --MCLinflation not "NA" [default 2] |
[int] |
--clMaxSDdist |
Gene CNVs with distance from the cluster centroid > --clMaxSDdist standard deviations from the mean distance are removed from the cluster. High values make this filter unffective. [default Inf] |
[double] |
--clMinSize |
Min number of members in a cluster [default 2] |
[int] |
--edgesMeanCorFilter |
NETWORK. Remove edges representing CNV correlation scores lower than the mean absolute CNV correlation |
|
--edgesPvalueFilter |
NETWORK. Remove edges with adjusted pvalue below this threshold [default 0.1] |
[double] |
--debug |
Dump session and quit |
|
-h, --help |
Show help message |
Description
The geInteraction module aims at detecting CNV genes across multiple samples and identifying gene interactions using a correlation-based network approach.
The algorithm steps:
Load the GIP files with the gene sequencing coverage values (.covPerGe.gz files) of all samples,
Select CNV genes. These are defined as the genes with a normalized coverage variation within the sample set greater than –minDelta.
Compute all-VS-all gene coverage correlation
Compute correlation clusters (cc) using one of the clustering algorithms: mclust (default), kmeans (
--kmeansClusters), MCL (--MCLinflation).Optionally remove CNV genes belonging to small cc (
--clMinSize), or placed at a significant distance from the cluster centroid. To do that, for each cluster the module measures the centroid, the mean euclidian distance and the standard deviation. Cluster members whose distance from the centroid is greater than--clMaxSDdiststandard deviations from the mean are removed.Generate the gene normalized coverage heatmap (“.CNV.pdf”) and table (“.CNV.xlsx”). The heatmapType parameter has 4 options. If "scaled" values are first centered subtracting the mean gene normalized coverage across samples, then scaled dividing by the standard deviation. If "log10" values are log10 transformed. If "saturated" values are saturated at --covSaturation. If "flatten" values are first subracted by the min gene normalized coverage across samples, then saturated at --covSaturation. The latter visualization option is useful to appreciate coverage variations of genes that are highly amplified in all samples.
Plot the all-VS-all correlation heatmap (“.corr.pdf”) and table (“.corr.xlsx”). The plot file include also a line plot showing the scaled normalized gene coverage of genes in each cc across samples.
Produce PCA scatterplots and standard deviation and entropy histograms as general descriptors of detected CNVs (“.overview.pdf”).
Compute static and interactive correlation networks based on all-VS-all CNV absolute correlation. The network nodes represent gene CNVs and the edges the absolute correlation value. The higher the correlation the closer the nodes. Edges colors indicate whether the correlation between gene pairs is positive or negative. The color of the nodes reflect the network clusters (nc) computed with either of the clustering algorithms. The same options used to select the cc clustering method (
--kmeansClustersand--MCLinflation) and the cc filters (--clMinSizeand--clMaxSDdist) apply also to nc. Between cc and nc there are two important differences. The first is that cc are based on pearson correlation values (i.e. including both positive and negative scores), while nc are based on the absolute correlation scores. The difference second is that cc quality remove CNV genes from all results, while nc filters will impact only the network plot and tables.
Example
giptools geInteraction --samplesList samplesMetaDatageInteraction module requires to specifty the --samplesList parameter providing a tab separated file where the first column is the list of the sample names to be processed. Optionally columns can be passed with additional sample meta data information (e.g. drug resistance, geographic origin, operator) and the colors to by assigned to each feature. If no color is provided this will be assigned randomly. In this example the sampleMetaData file is this. The output of this module consists of eight files.--cutree_samp and --cutree_cnv can be used to split the heatmap at the sample (columns) and CNV (rows) levels respectively.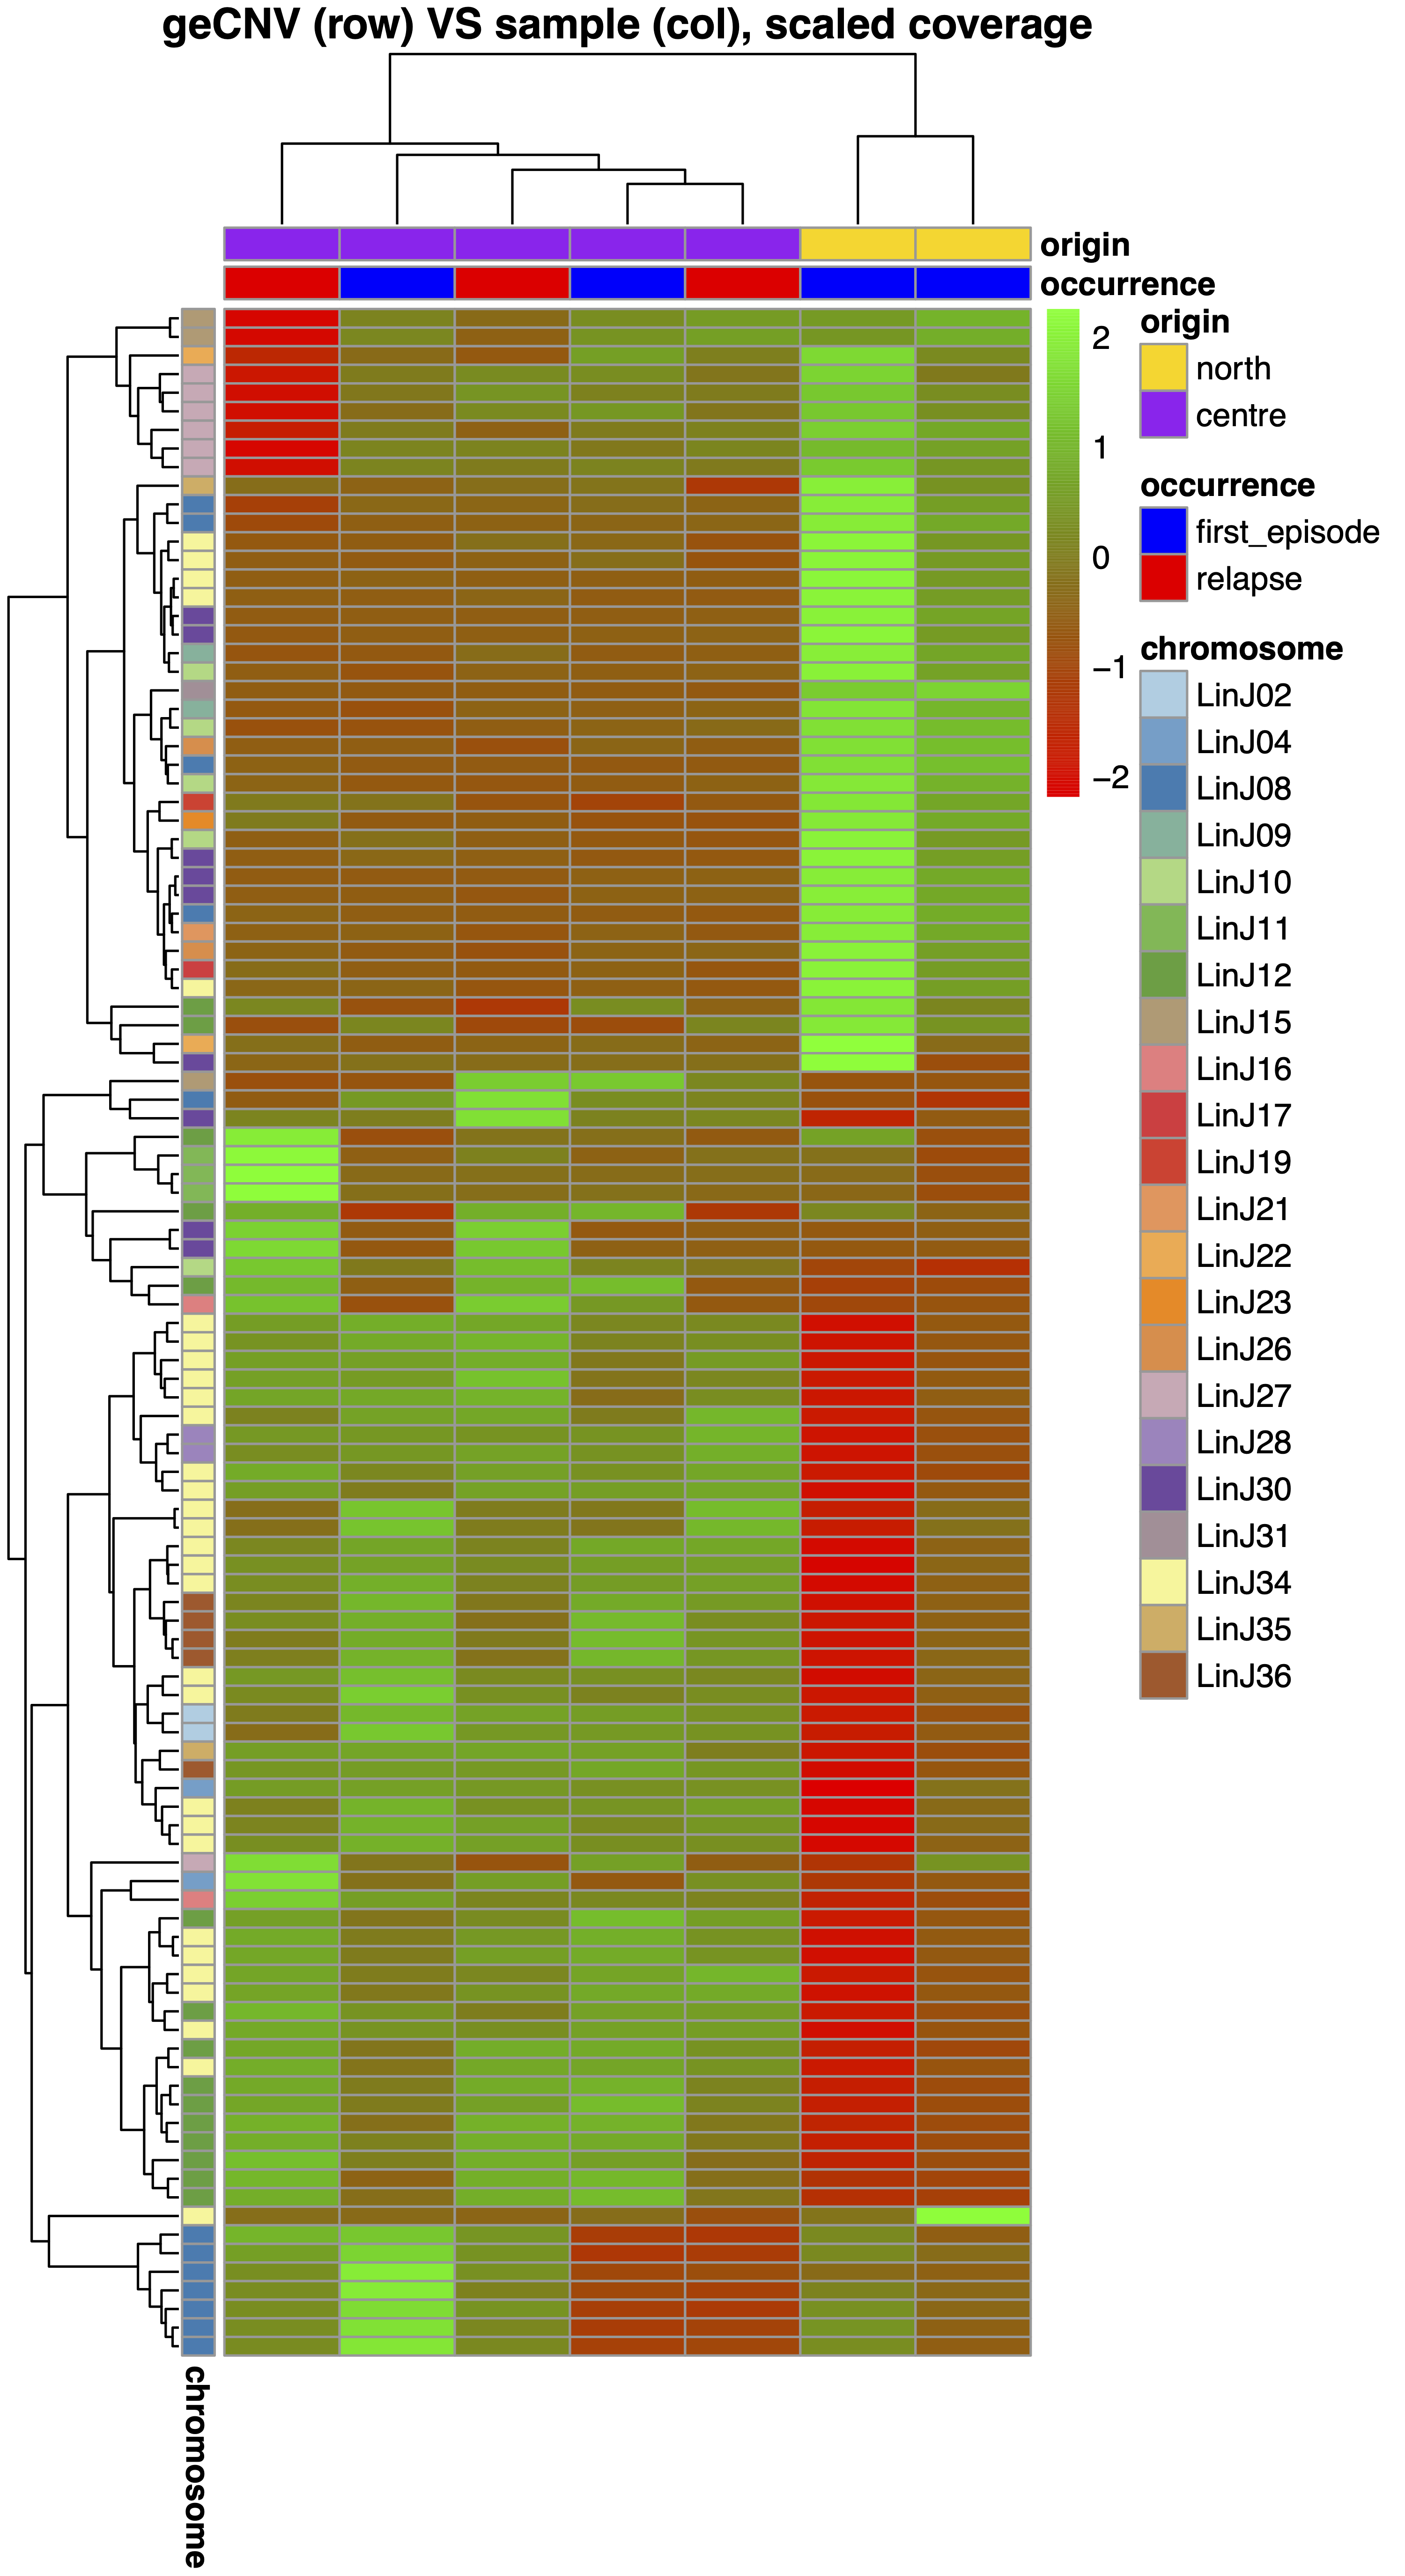

--cutree_cnv option can be used to split the CNVs (both on the columns and rows) in different groups.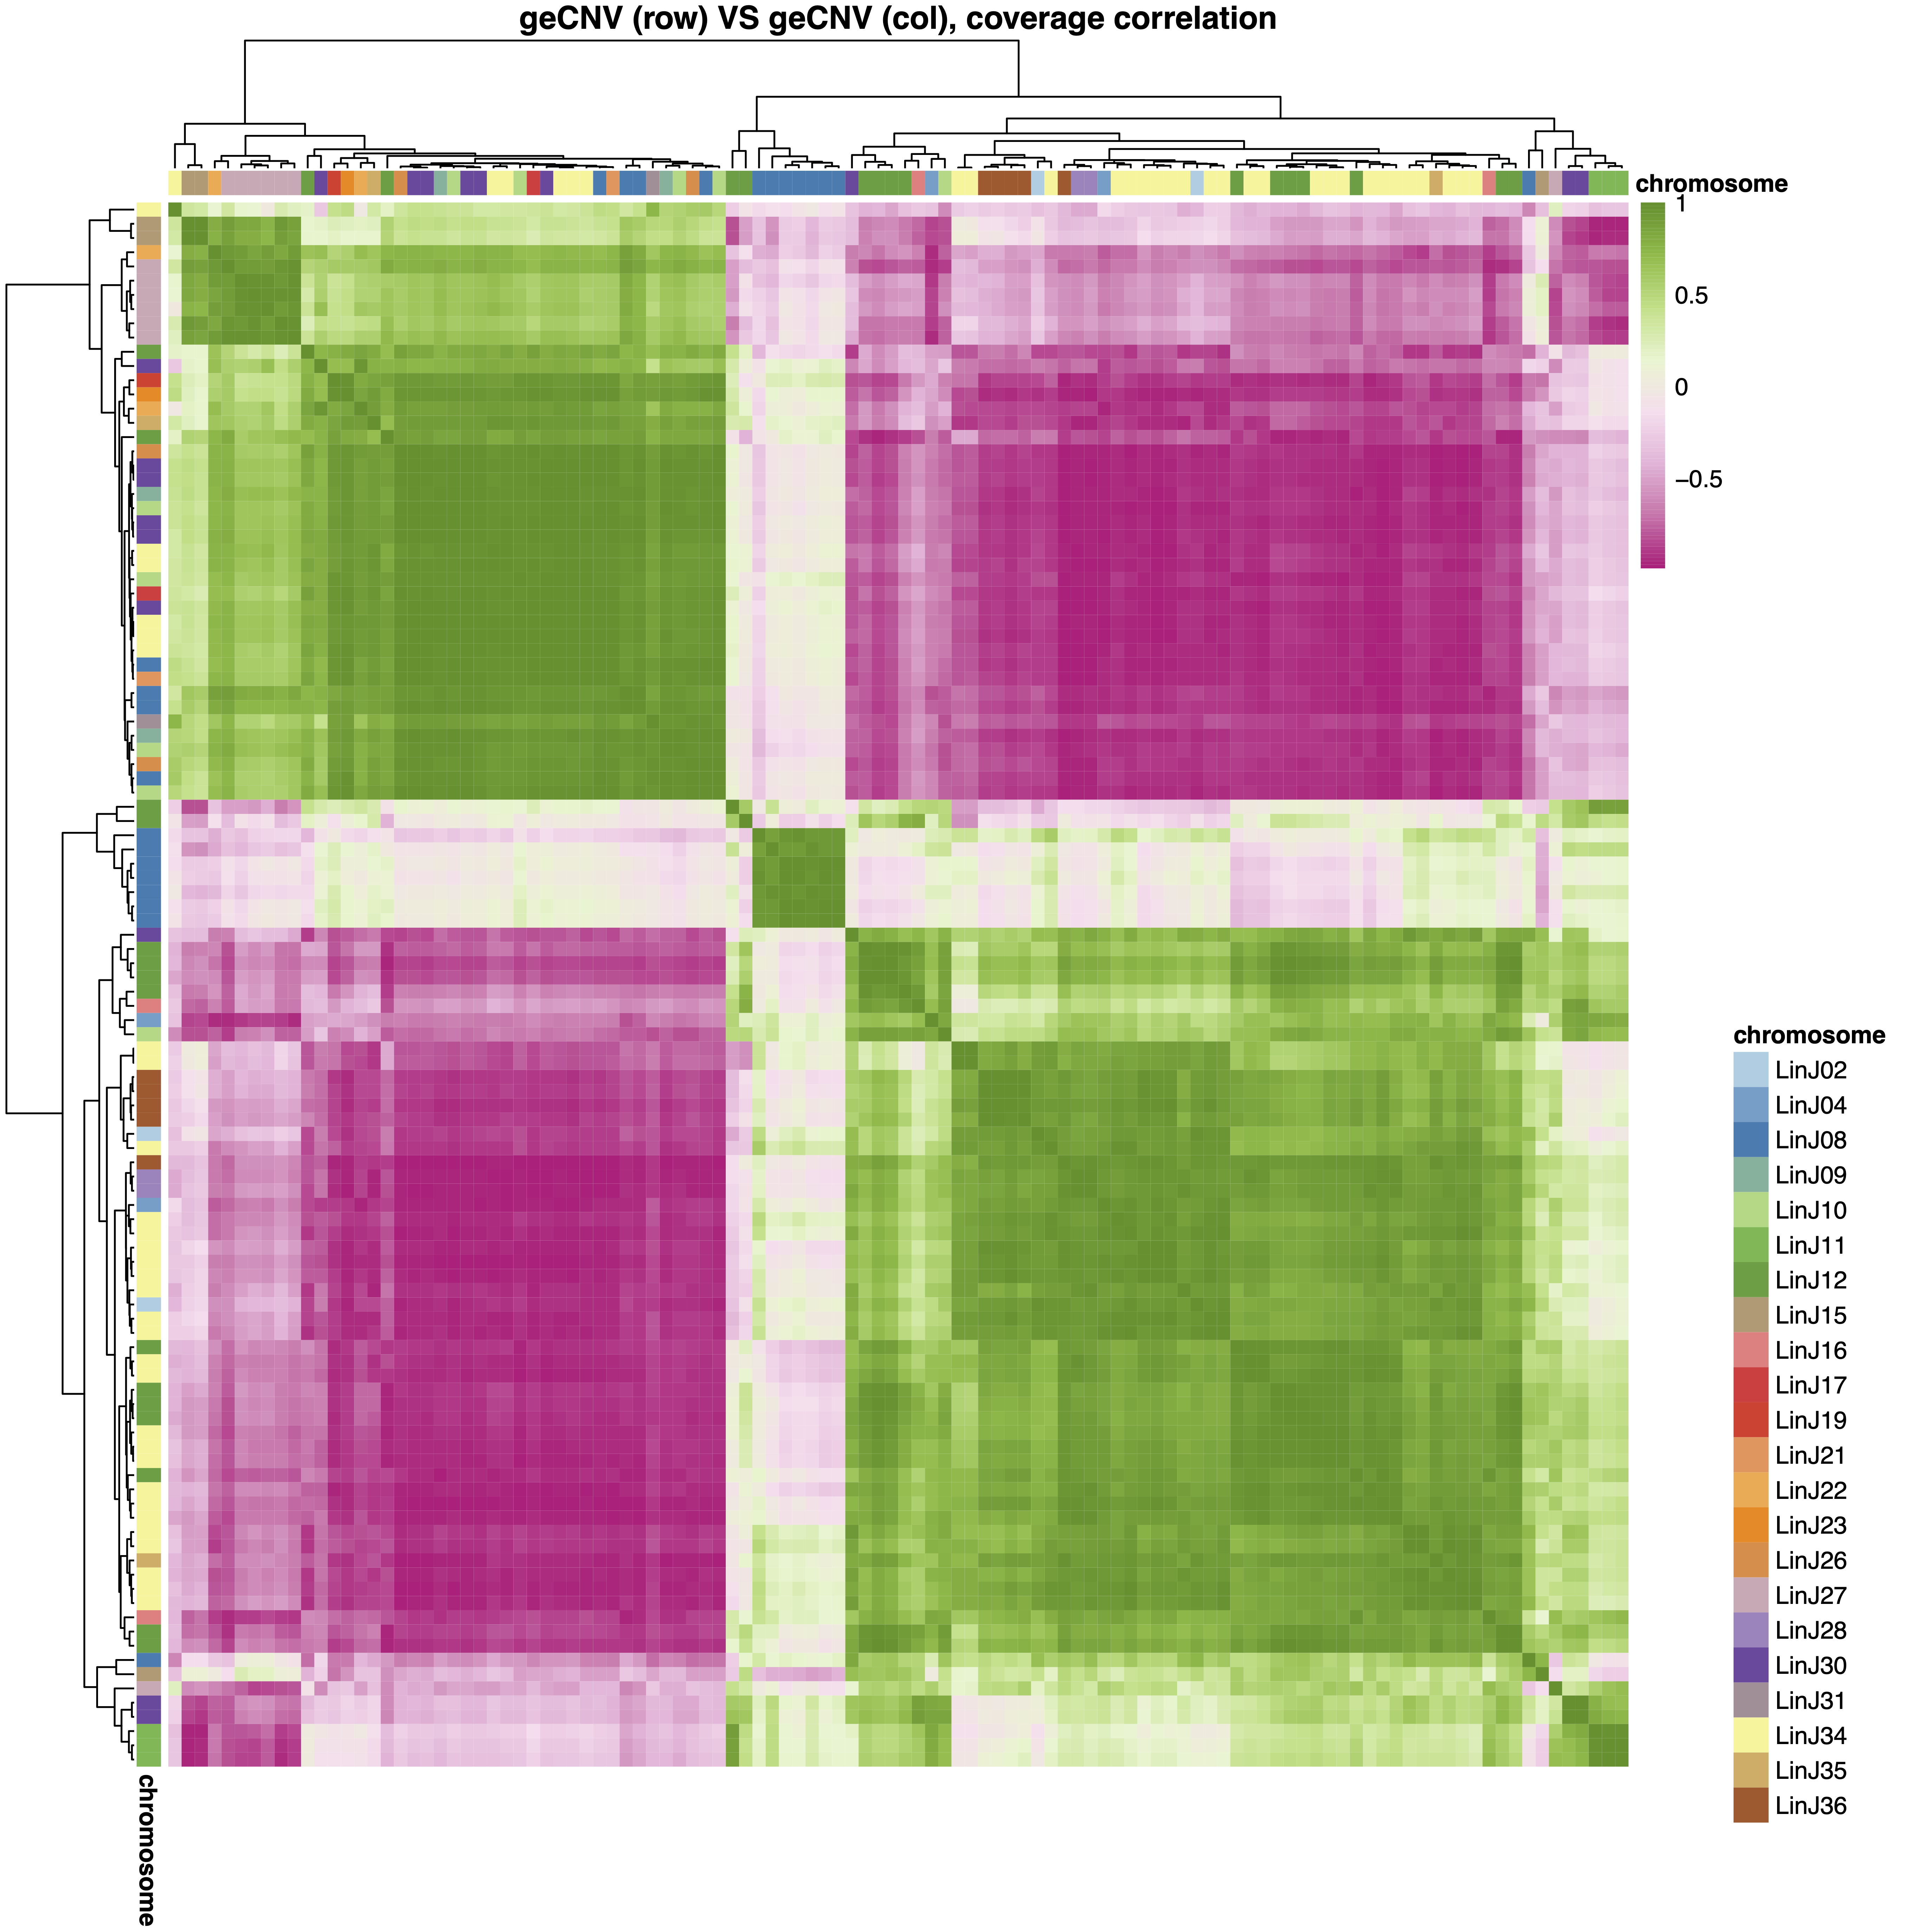
--kmeansClusters 3 returns the following plot: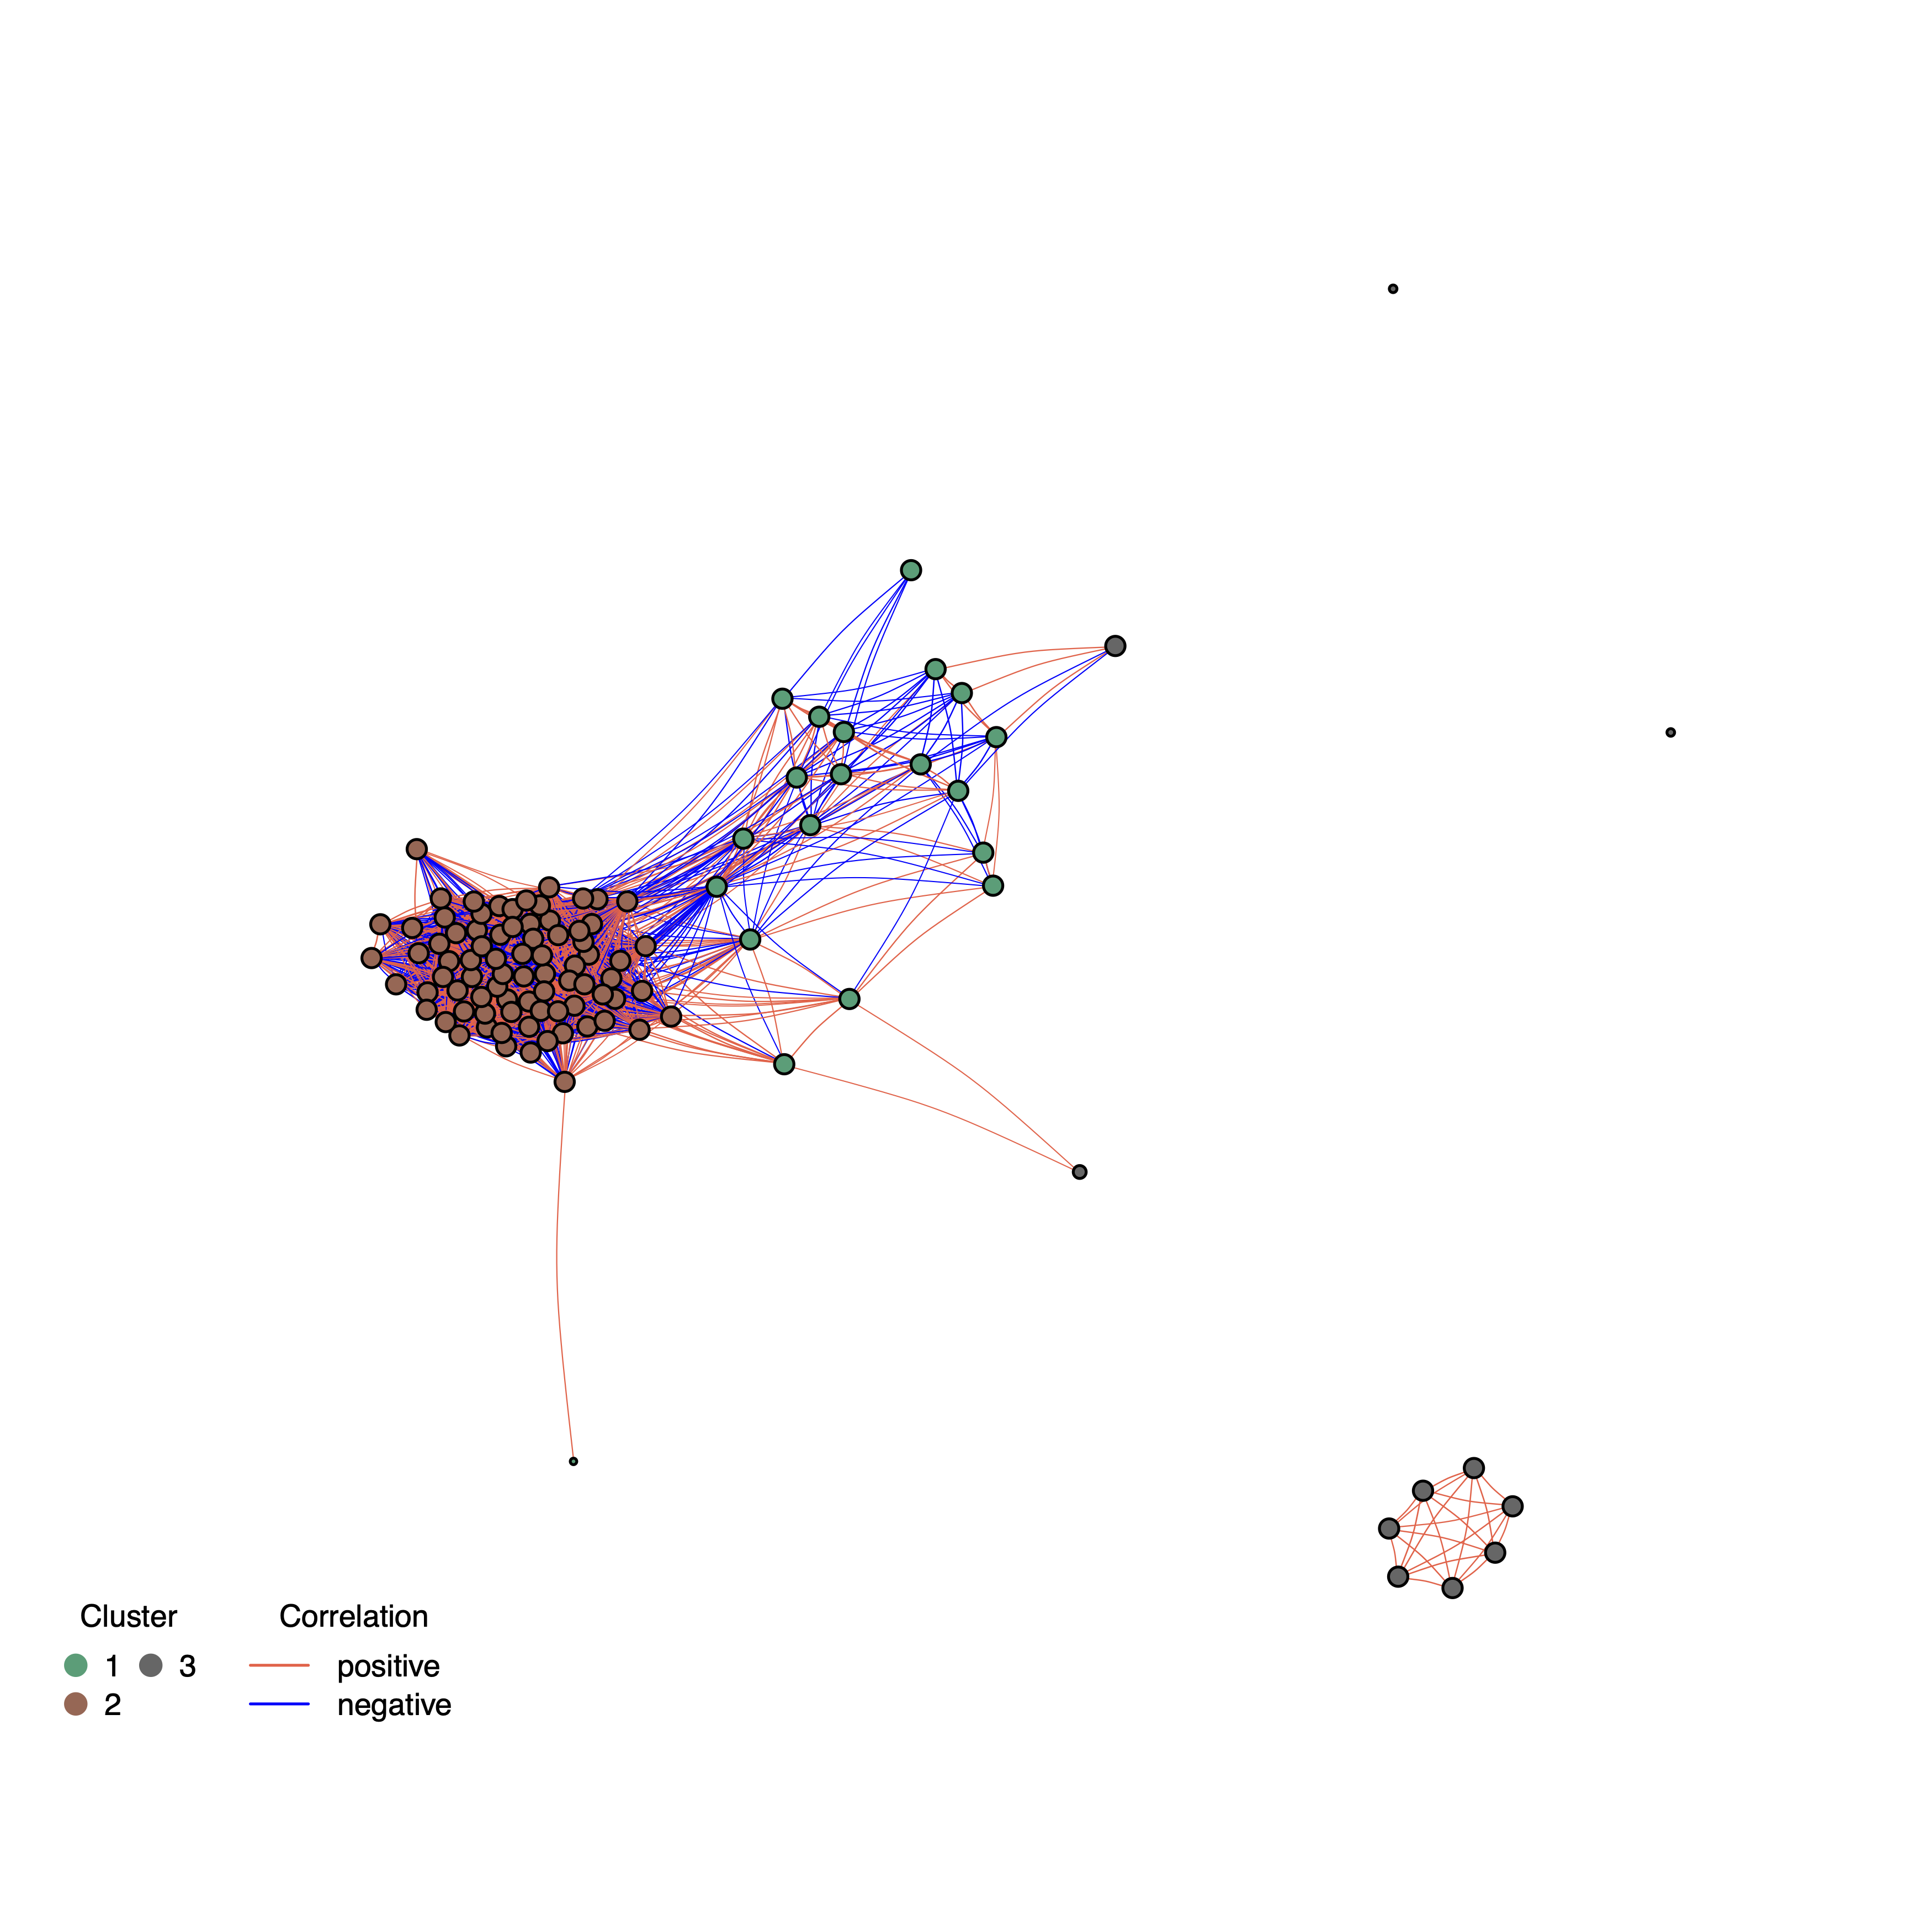
sampleInfo. This is a copy of the provided sample meta data showinf the features colors and reporting the sample branch group assignment in the geInteraction.CNV.pdf heatmap.
cnvInfo. This table includes the relevant statistics measured for the detected gene CNVs, including the most positivelly and negativelly correated genes partners, the gene CNV branch group and cc assignment in the geInteraction.CNV.pdf and geInteraction.corr.pdf heatmaps.
normGeneCoverage. This table includes the normalized gene coverage across the samples of interest.
The data in each spreadsheed is sorted the same way as the geInteraction.CNV.pdf heatmap.