ternary
Options
Option |
Description |
Argument |
|---|---|---|
--samples |
Sample names. It determines the plotting order [required] |
[char …] |
--gipOut |
GIP output directory [default gipOut] |
[char] |
--outName |
Output name [default gipOut/sampleComparison/ternary] |
[char] |
--chrs |
Chromosomes to use. If “NA” it uses the same chromsomes as GIP [default NA] |
[char …] |
--MAPQ |
Label genes with MAPQ < –MAPQ [default 0] |
[int] |
--pseudocount |
Normalized mean coverage pseudocount value (for plots only) [default 0.1] |
[double] |
--colorByDelta |
Color genes by increasing delta |
|
--highLowDeltaColor |
Colors for high and low delta. DEPENDENCY --colorByDelta [default darkgreen black] |
[char char] |
--showDensity |
Show log 10 scaled density area |
|
--highLowDensityColor |
Colors for high and low density DEPENDENCY --showDensity. [default black deepskyblue] |
[char char] |
--showQuantile |
Show genes/clusters with a delta coverage greater than this quantile cut-off. DEPENDENCY –showDensity [default 0.99] |
[double] |
--densityN |
Number of grid points in each direction DEPENDENCY –showDensity [default 200] |
[int] |
--densityBins |
Number bins over which to calculate intervals DEPENDENCY –showDensity [default 8000] |
[int] |
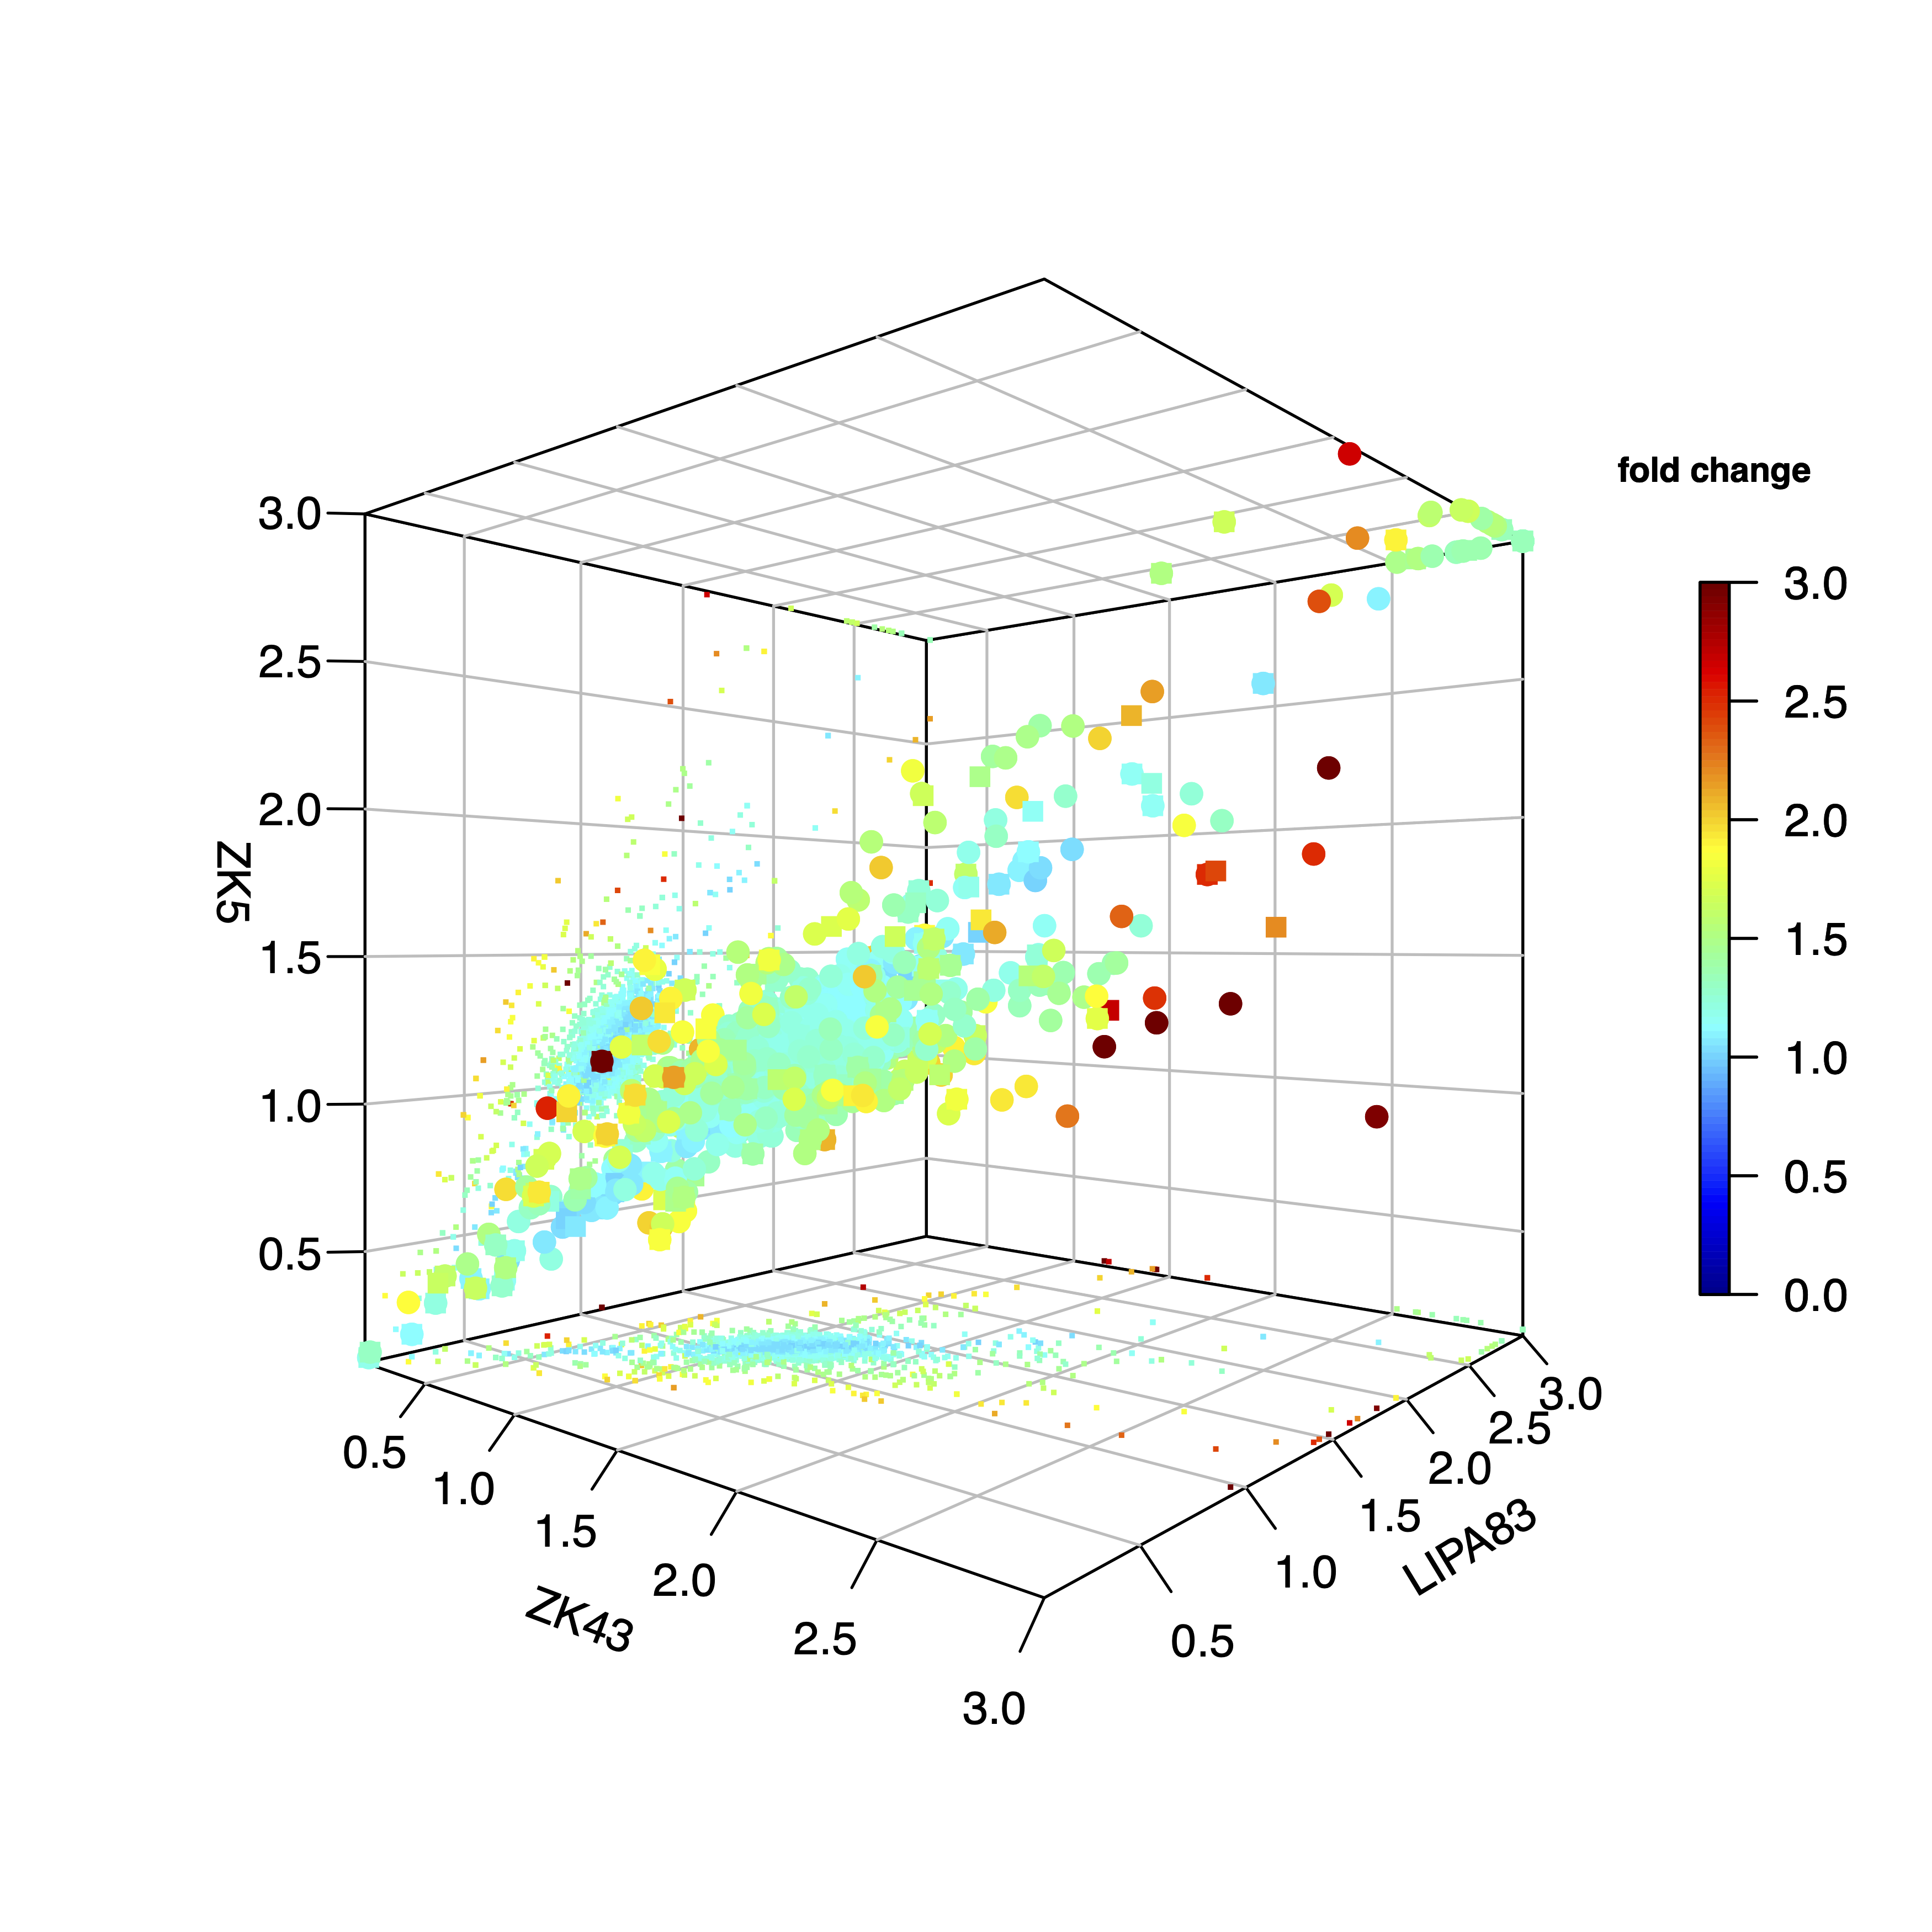
--plot3dMaxCOV |
3-D scatteplot visualization threshold. Gene/cluster coverage values greather than this threshold are shown as --plot3dMaxCOV [default 3] |
[double] |
--plot3dMaxFC |
3-D scatteplot visualization threshold. Gene/cluster coverage fold change values greather than this threshold are shown as --plot3dMaxFC [default 3] |
[double] |
--debug |
Dump session and quit |
|
-h, --help |
Show help message |
Description
ternary module aims at comparing the gene sequencing coverage of 3 samples to identify gene CNVs.Example
giptools ternary --samples ZK43 LIPA83 ZK5
--colorByDelta option will result in the following plot, in which the delta coverage (defined as the difference between the max and min normalized coverage) is colored in a customizable scale whose intensity reflects the delta coverage size.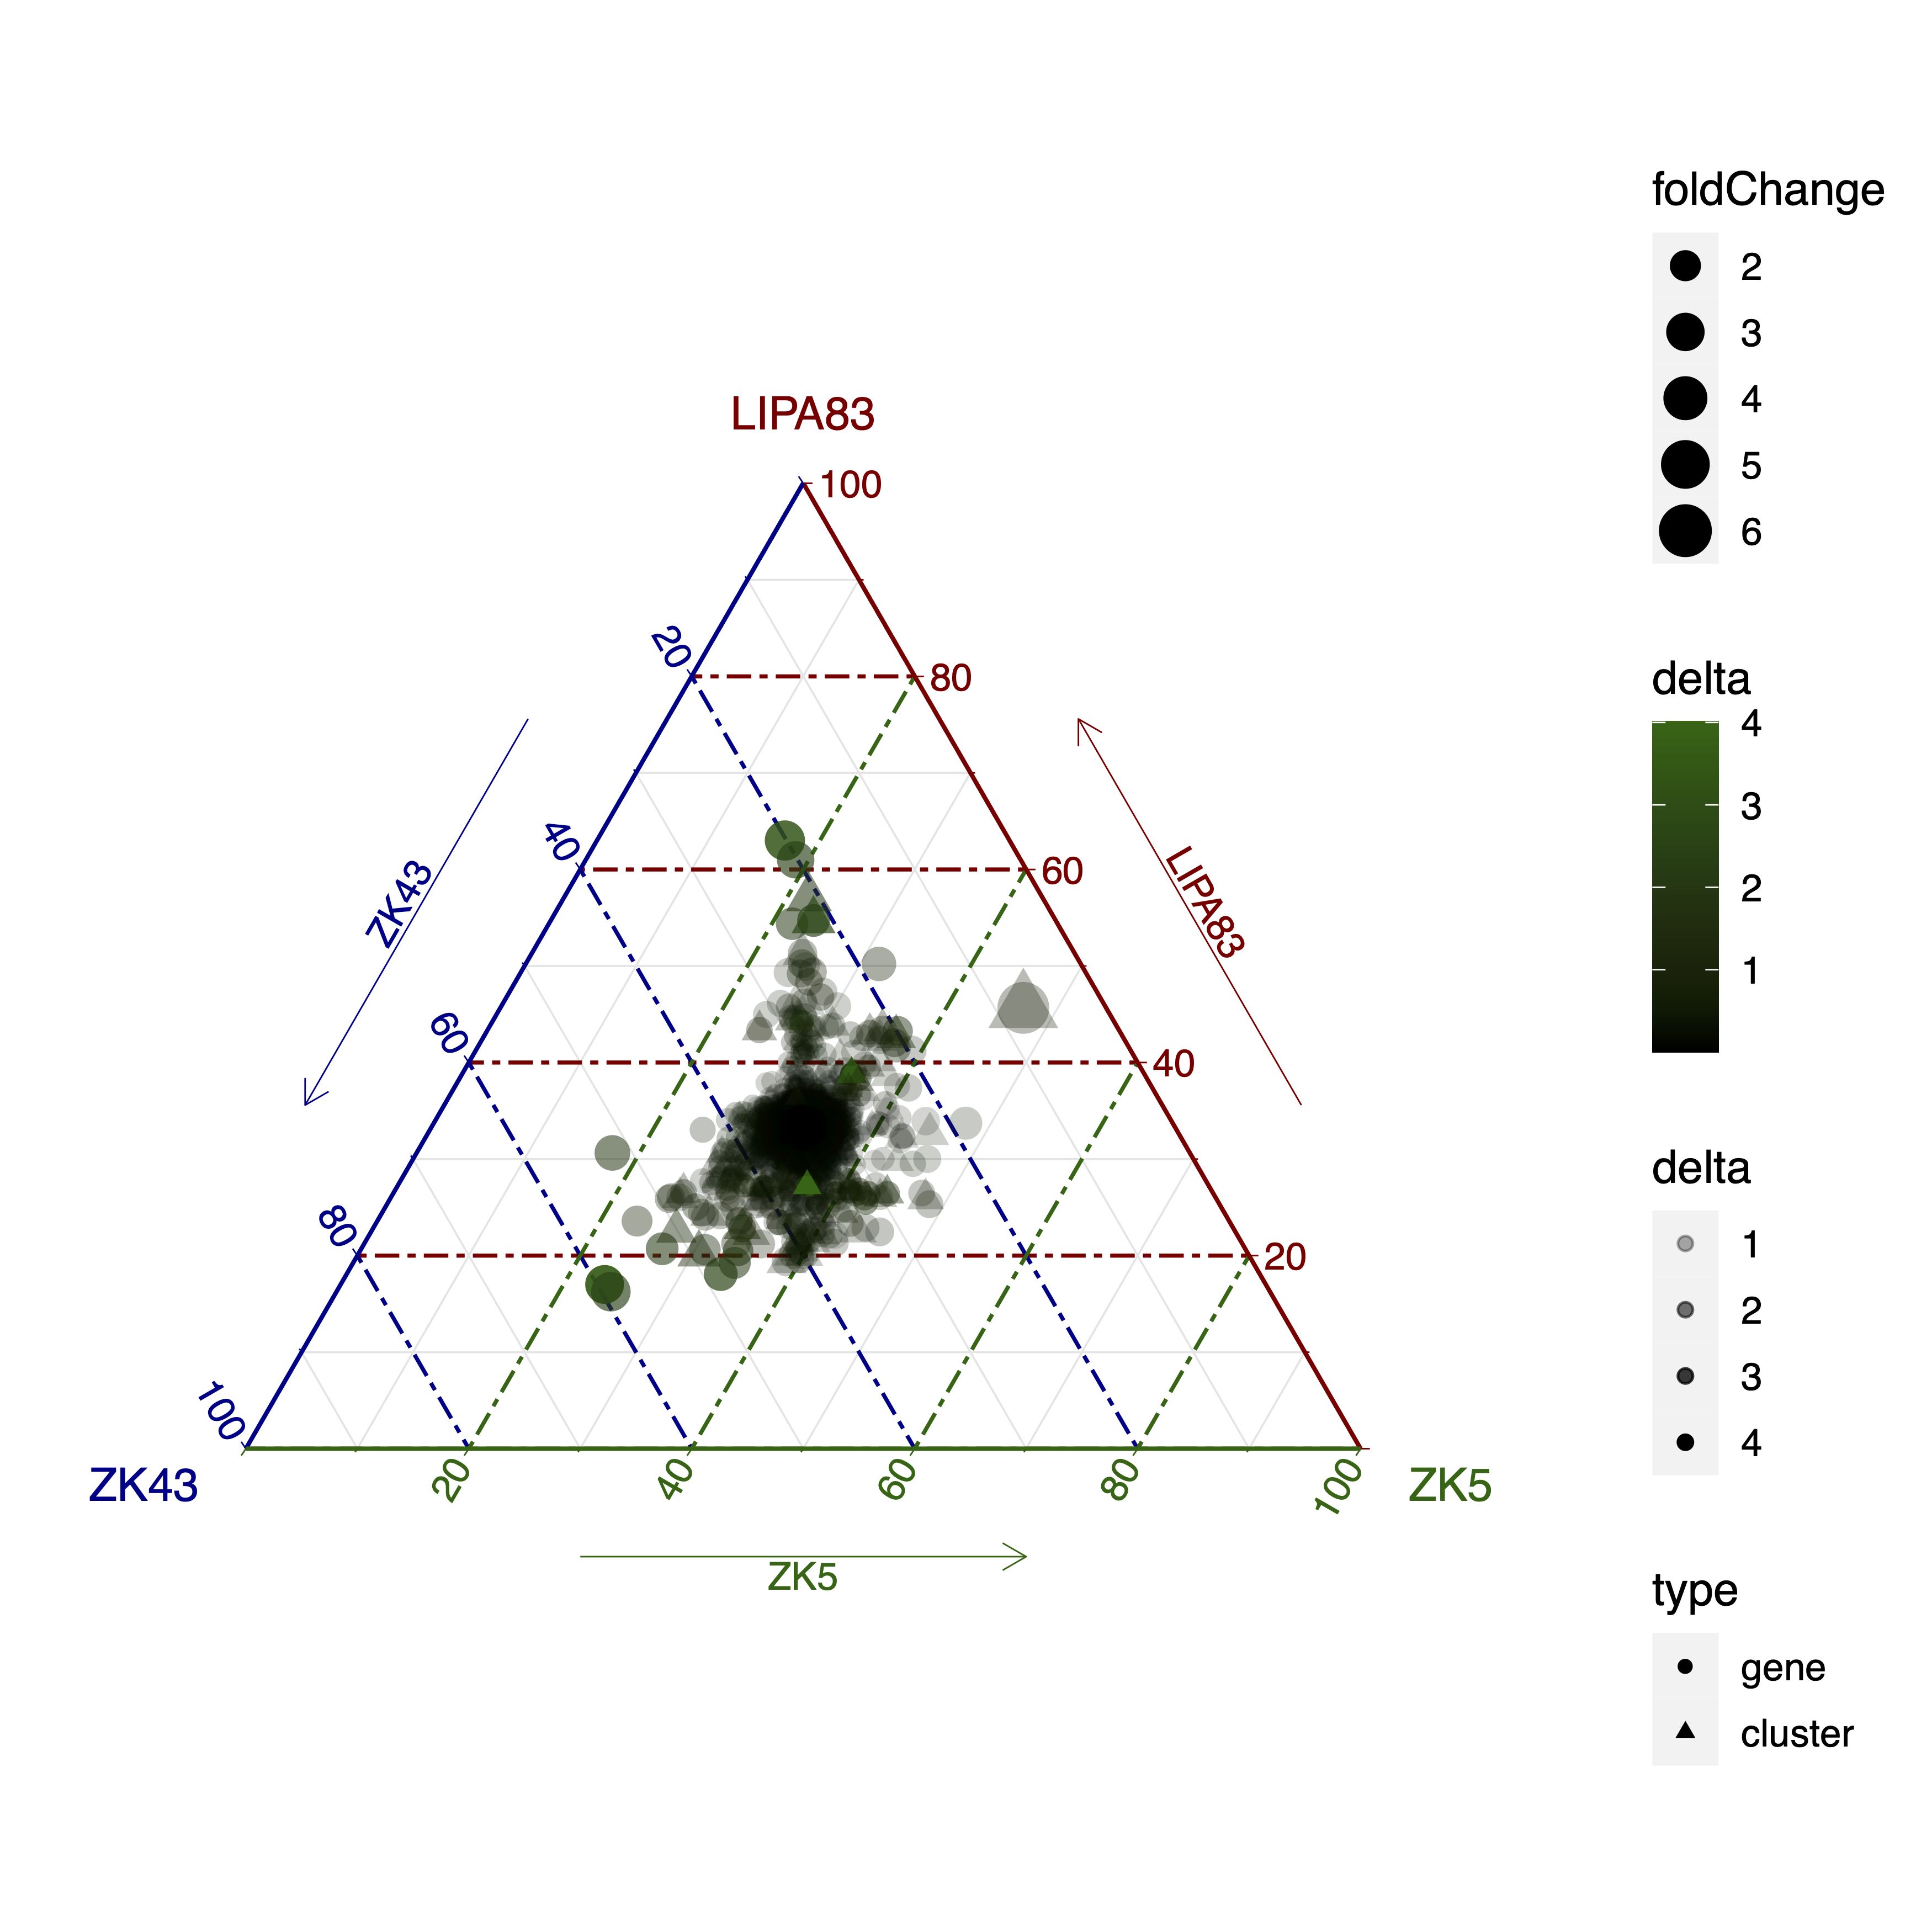
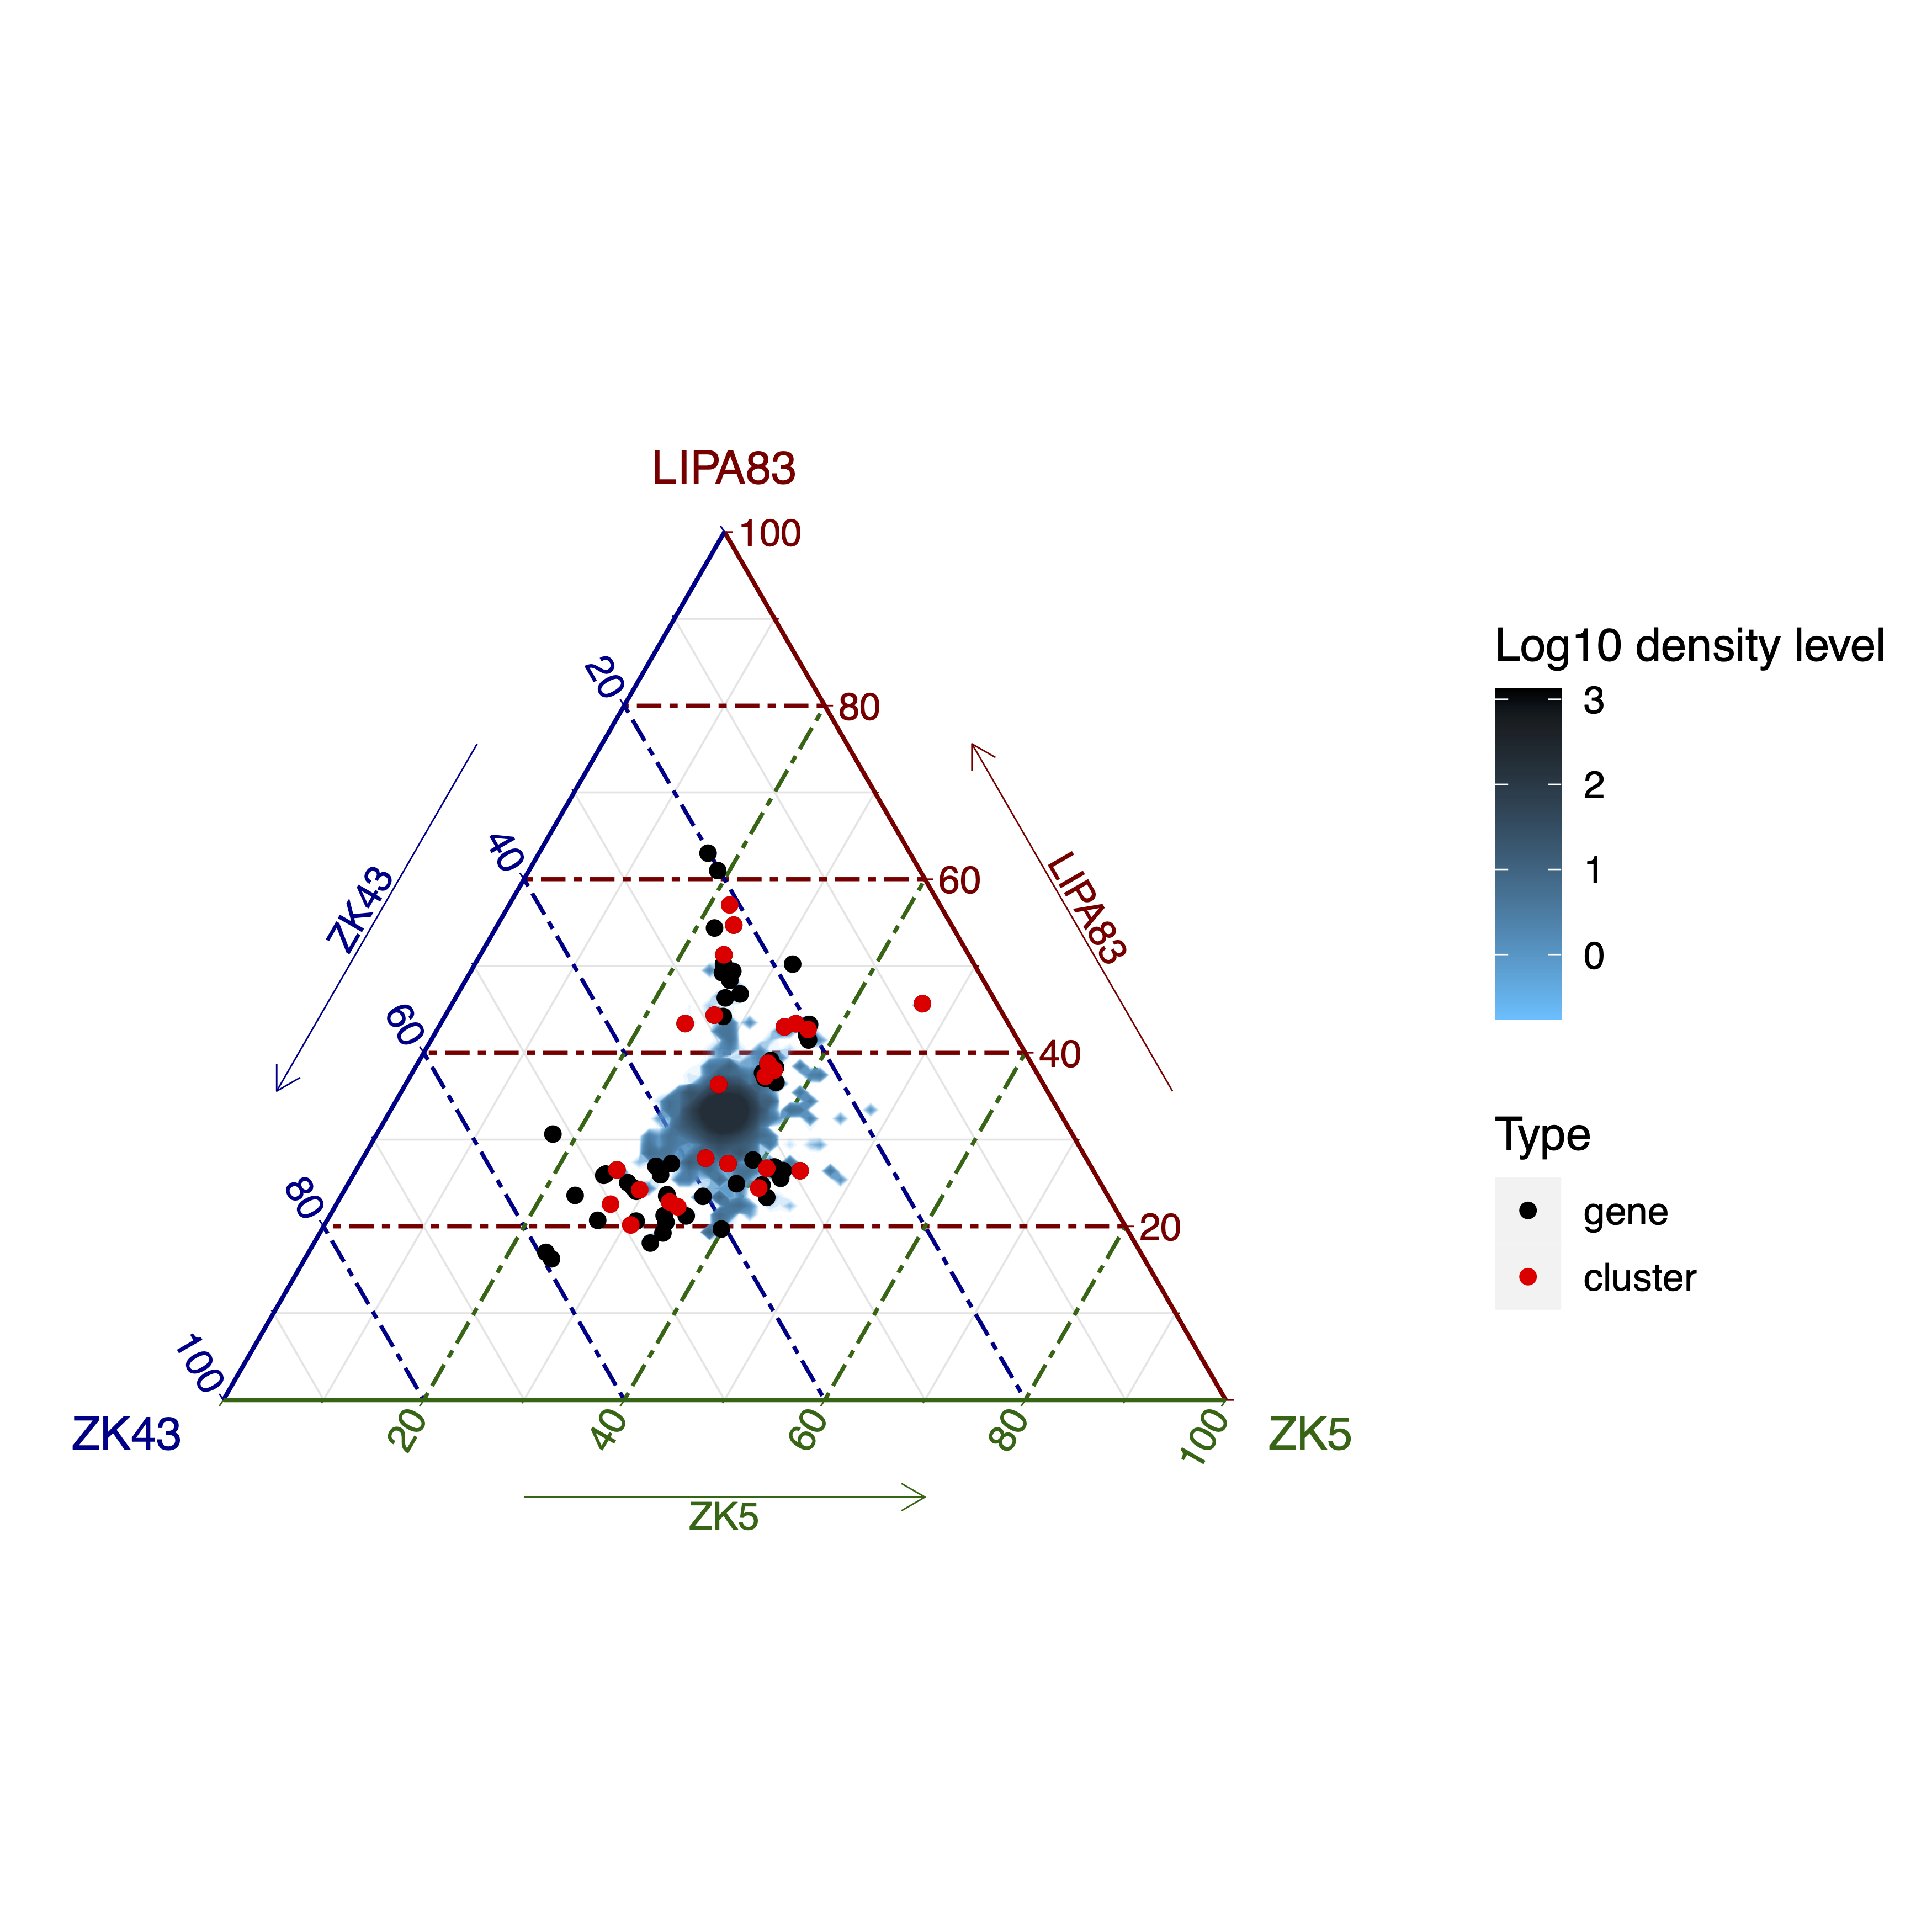
--showDensity option will result in a log10 scaled density representation of the genes (and gene clusters if present).--showQuantile option regulates the number of high-delta coverages and gene clusters to be shown together with the density plot. Please note that high copy genes can have high delta coverage values, but still be placed roughly in the middle of the triangular plot. For instance, in this representation a gene present in the three samples in 12, 10 and 10 copies will be more central than a gene with 3, 1 and 1 copies. While the delta value is the same (2), the fold change is very different in the two cases (respectivelly 1.2 and 3). The triangular plot with the density option in this example is the following: