karyotype
Options
Option |
Description |
Argument |
|---|---|---|
--samples |
Sample names. It determines the plotting order If “NA” all samples are used [default NA] |
[char …] |
--gipOut |
GIP output directory [default gipOut] |
[char] |
--outName |
Output name [default gipOut/sampleComparison/karyotype] |
[char] |
--minMAPQ |
Remove bins with MAPQ < –MAPQ [default 0] |
[int] |
--chrs |
Chromosomes to use. If “NA” it uses the same chromsomes as GIP [default NA] |
[char …] |
--ylim |
Min and max plot y-axis limits [default (0, 10)] |
[int] [int] |
--makeQqplots |
Computes Q-Q plots for all chromosomes in all samples combinations |
|
--disomicChr |
Normalize by this chromosome [default NA] |
[char] |
--customColors |
TSV file with 2 columns named “SAMPLE” and “COLOR” indicating the color to be used for each sample If “NA” colors are automatically assigned [default NA] |
[char] |
--geom |
Select boxplot or violin [default boxplot] |
[boxplot|violin] |
--pooled |
Pool all samples together (i.e. one box per chromosome representing the coverage values of all samples) |
|
--debug |
Dump session and quit |
|
-h, --help |
Show help message |
Description
karyotype module aims at comparing the chromosome sequencing coverage distributions of multiple samples. This module is useful when trying to detect chromosome ploidy differences in different isolates.The --disomicChr option is useful to recenter somy scores on a user defined disomic chromosome.
Under the assumption that most of the genome is disomic, the somy score is simply calculated multiplying by two the bin scores.
However, depending on the biological system under investigation, many/most chromosomes may show aneuploidy.
In this case the somy score distribution of a given disomic chromosome may not be exactly centered on 2, and different samples may give slightly shifted readout for the same disomic chromosome.
To address this problem the user can perform a first run of giptools karyotype to identify a chromosome whose median coverage is as close as possible to a value of 2, and that it is stable across the samples set. In a second run of giptools karyotype the user can then specify the chromsome name with the --disomicChr option.
By doing that the somy scores will be calculated by dividing the bins coverage scores by the median score of the chromosome deemed to be disomic and then multiplied by 2.
To compare coverage distribution shapes the script can optionally generate Q-Q plots (slow), comparing the quantiles of the two bins distributions. If the dots (quantiles) are on the diagonal, then their distributions have the same shape.
Example
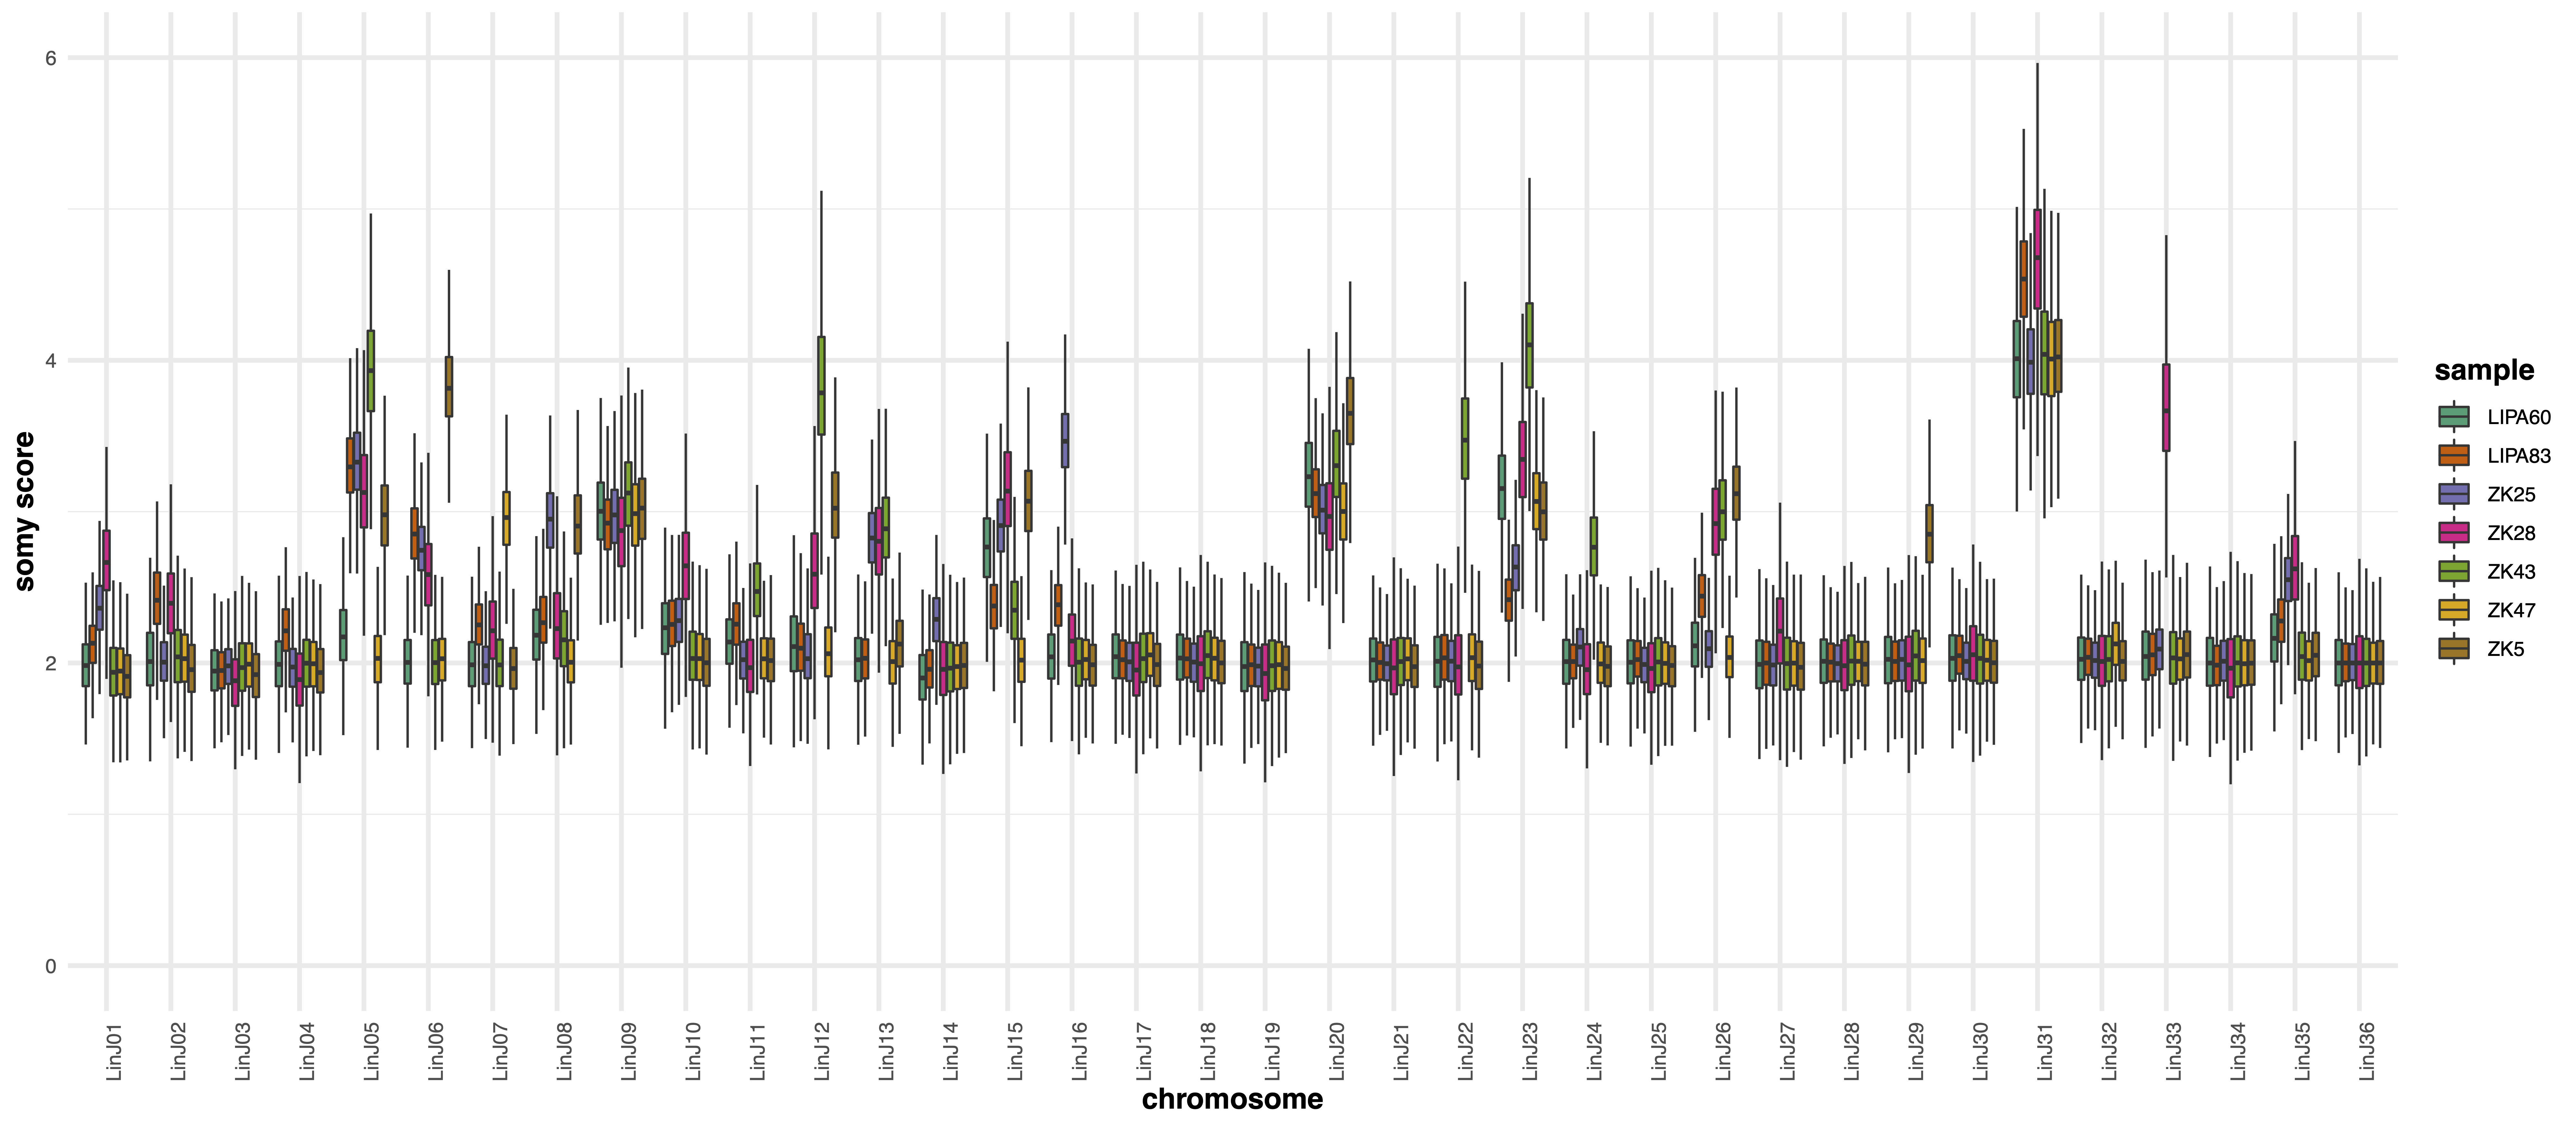
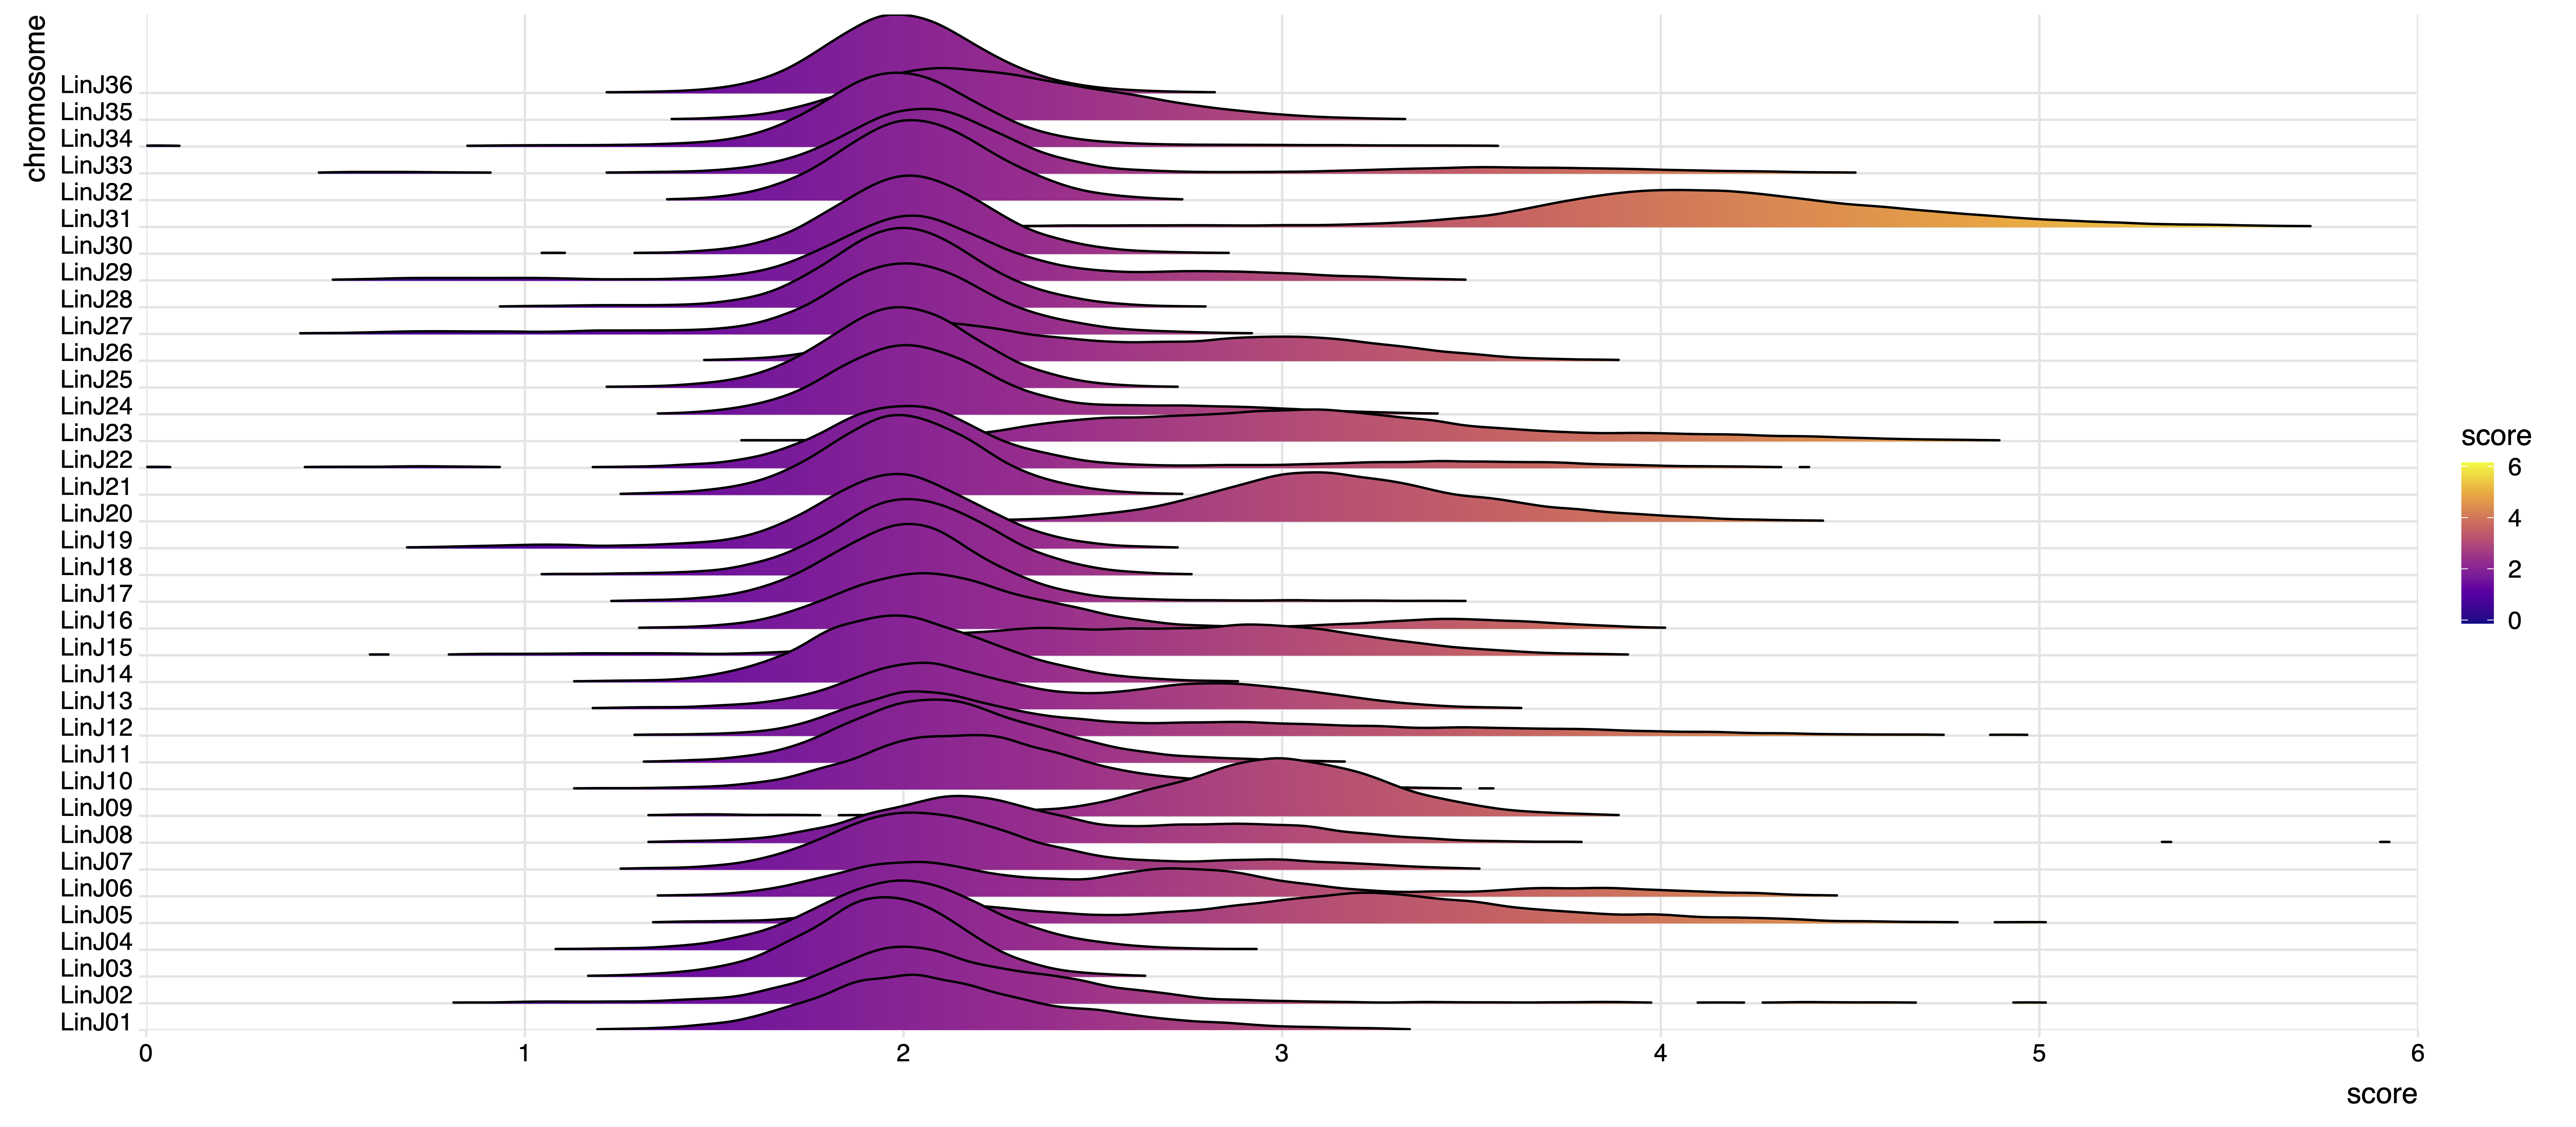
giptools karyotypegiptools karyotype --ylim 0 6 --disomicChr LinJ36A .pdf file including two plots
An .xlsx files with 5 data sheets
The two plots represent the chromosome somy scores as boxplots and density distributions. The example produces the following plots:
The karyotype module performs the Wilcoxon, Kolmogorov-Smirnov and AOV tests on the somy score distributions to test the significance of chromosome coverage variations in the different samples. The output statistics are reported in the .xlsx file which includes the following data sheets:
Wilcoxon tes p-value scores
Kolmogorov-Smirnov (KS) test p-value scores
One way ANOVA test (AOV) p-value scores
Difference between the normalized median chromosome coverage scores
Normalized median chromosome coverage scores